
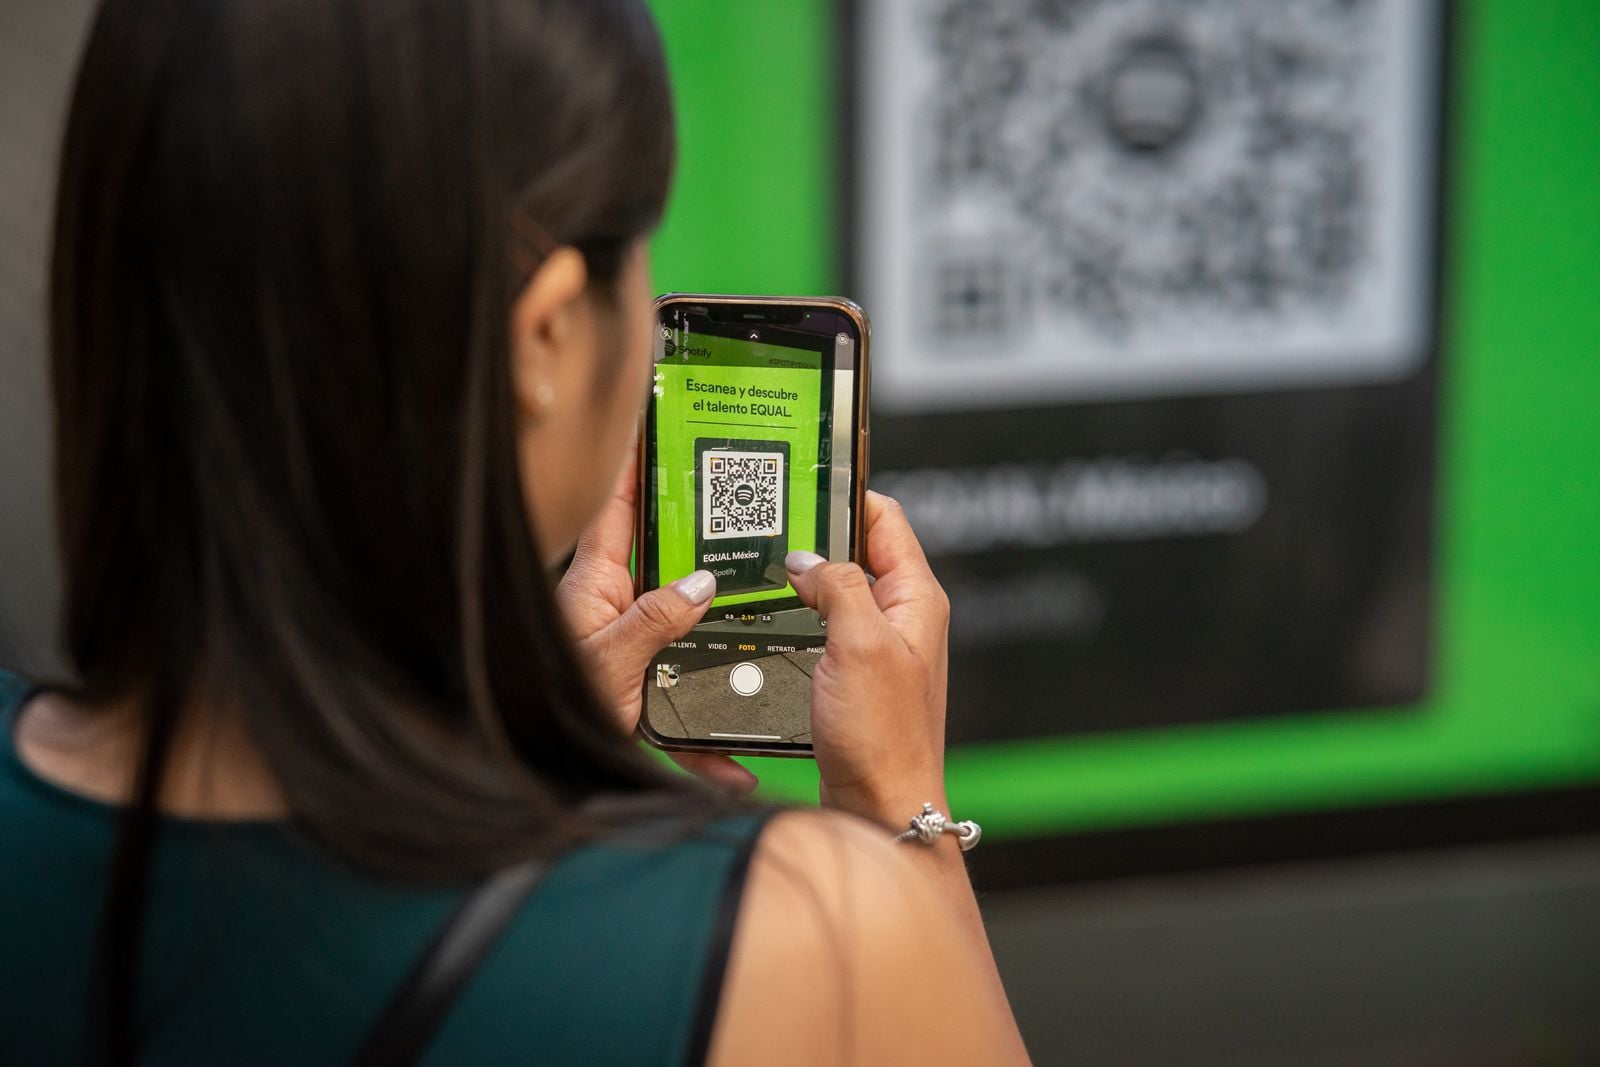
Point a phone at a standard QR code taped to a lamppost. The camera can be tilted, the paper can curl, and part of the grid can sit in shadow, yet the code may still resolve in a fraction of a second. Three large nested squares tell the reader where the symbol is and how it is rotated, while a separate layer of redundant codewords gives the decoder a chance to rebuild information that was read incorrectly.
Those are two different protections. The finder patterns solve a geometry problem, while Reed-Solomon error correction solves a data problem. At the strongest setting, a QR code can restore roughly 30 per cent of its total codewords, but that is not a guarantee that any randomly chosen 30 per cent of the visible square can be covered.
Why three squares, and why that ratio
The QR code emerged from Japanese manufacturing in the early 1990s, when workers were scanning several one-dimensional barcodes to identify and track parts. Masahiro Hara led a two-person development team at Denso, in the operation that later became Denso Wave, and the company released the QR code in 1994 with high-speed reading as its central goal.
Hara has said that the black and white stones of the board game Go helped him see how information could be arranged across a grid instead of along a single line. The important engineering step came after that idea: the new symbol needed a mark that a reader could pick out rapidly from text, packaging, machinery, and everything else in a camera’s field of view.
The team settled on a nested black-white-black square. A scan through its centre produces bands in the proportion 1:1:3:1:1, a ratio Denso says its engineers chose after analysing printed material to find a sequence unlikely to appear by accident. Hara later described the long search through newspapers, magazines, letters, and symbols in a 30th-anniversary interview.
Each finder is seven modules wide. It contains a dark 3-by-3 centre, a one-module light ring, and a one-module dark border, separated from the encoding region by a light margin. The geometry gives a decoder a distinctive run of dark and light widths before it has interpreted any message data.
Three copies appear at the upper-left, upper-right, and lower-left corners of a standard square QR code. Once those positions are identified, the reader can determine the symbol’s location and rotational orientation, including when the printed square is upside down or turned at an awkward angle. The missing fourth finder also helps distinguish the corners from one another.
The three large squares do not carry the URL. They are function patterns, fixed landmarks that must survive for the reader to locate the grid. Covering one of them is therefore much riskier than covering the same-sized patch in an ordinary data region.
Most standard QR codes also contain smaller alignment patterns. Version 1 has none, while Version 2 and above add them in positions defined by the symbol size; the largest versions use many. Denso explains that these patterns help Model 2 codes remain readable when the image is distorted by a curved surface or an oblique camera angle.
What the code reads before the message
Thin alternating rows and columns connect the finder areas. These timing patterns help the decoder estimate the spacing of individual modules and reconstruct the grid even when the photographed code is not perfectly square. A clear border called the quiet zone, four modules wide around a standard QR code, keeps nearby text and graphics from being mistaken for part of the symbol.
Standard QR codes come in 40 versions. Version 1 is a 21-by-21 grid, and each step adds four modules per side until Version 40 reaches 177 by 177, according to Denso’s version table. Larger grids can hold more information, but they also need smaller printed modules or a physically larger square.
Not every black or white module represents one bit of the user’s message. Finder, separator, timing, alignment, format, and version areas are reserved for the reader itself. Only the encoding region carries the interleaved data and error-correction codewords.
The message begins with a mode indicator and a character count, followed by data encoded in numeric, alphanumeric, byte, or Kanji mode. Denso notes that the Kanji mode can encode supported Japanese characters in 13 bits, one of several decisions that reflect the format’s origin in Japan. The resulting bit stream is padded and divided into eight-bit codewords before error correction is added.
The encoder then tests eight masks that selectively flip data and error-correction modules. The point is not secrecy. The masks reduce visual arrangements that are difficult for scanners, such as long runs of one colour, badly unbalanced dark and light areas, or accidental shapes resembling finder patterns.
All eight candidates are scored, and the lowest-penalty result becomes the printed symbol. A technical QR encoding guide shows that the masks apply only to the data and error-correction region, not to the fixed function patterns. Small format-information areas beside the finders tell the reader which mask and which error-correction level were used.
Why 30 per cent needs an asterisk
Irving Reed and Gustave Solomon introduced their error-correcting method in a five-page paper in 1960 while working at MIT Lincoln Laboratory. Their scheme treats groups of bits as mathematical symbols and adds redundant symbols that allow a decoder to identify and repair errors. MIT’s history of the work traces its later use through deep-space communication, optical discs, and two-dimensional barcodes.
QR codes apply Reed-Solomon correction to eight-bit codewords. The encoder divides the message into blocks, calculates extra correction codewords for each block, and interleaves the results across the grid. Damage to one printed patch can therefore disturb pieces from several blocks rather than erasing one continuous stretch of the original message.
The standard offers four selectable levels: L, M, Q, and H. Denso lists their approximate restoration capacities as 7, 15, 25, and 30 per cent of total codewords. More correction requires more redundant codewords, leaving less room for the original payload at the same version.
The familiar 30 per cent claim applies only to Level H. A code generated at Level L has far less redundancy, while Level M is commonly used when capacity and resilience need to be balanced. The current international specification is ISO/IEC 18004:2024, which replaced the withdrawn 2015 edition linked in the original draft.
Even at Level H, the phrase 30 per cent damaged is shorthand rather than a promise about surface area. Denso defines the percentage against total codewords and warns that restoration may fail depending on the amount and pattern of dirt or damage. A sticker that wipes out finder patterns, timing information, or too many codewords in the same correction block can make a code unreadable well before one-third of the square looks covered.
That is why logos placed in QR codes are normally kept near the centre, sized conservatively, and tested on the finished print. The logo does not occupy a magical blank area. It deliberately destroys some encoded modules and relies on the selected error-correction level to repair the loss.
The process is mathematical rather than visual guesswork. The decoder compares the received codewords with the constraints created by the redundant symbols, locates errors, and reconstructs values when the number of damaged symbols remains within the code’s capacity. Denso’s error-correction guide describes the restoration rate in codewords for precisely this reason.
A patent built for adoption
Denso Wave owns patent rights connected to the QR code, but it made the specification public and waived enforcement of its patent for standardised QR codes. The company’s standardisation page records the route from an AIM standard in 1997 to a Japanese standard in 1999 and an ISO standard in 2000.
That decision allowed scanner makers, software developers, printers, phone manufacturers, and businesses to adopt one interoperable symbol without negotiating a fee for every use. The aim was to build an open market in which other manufacturers could produce the readers, software, and infrastructure needed for the format to spread.
The format spread first through industrial tracking and then into tickets, payments, authentication, advertising, and mobile links. Camera-equipped phones removed the need for a dedicated handheld reader, while the pandemic made the symbols newly visible on menus, check-in forms, and signs. None of those uses changed the basic geometry established in 1994.
The design has lasted because it assumes imperfect conditions. The finder patterns expect rotation, the alignment patterns expect distortion, the quiet zone expects visual clutter, and the correction codewords expect some modules to be lost. The symbol does not require the physical world to behave like a clean computer file.
That makes QR part of a small family of technologies whose visible shape preserves an old constraint. The GIF format still carries decisions made for dial-up connections, while the QWERTY keyboard still reflects the mechanics of nineteenth-century typewriters. In the same way, the three squares on a QR code still point back to a Japanese factory floor, while the apparently random modules around them keep a mathematical allowance for shadow, dirt, folds, and the sticker someone will eventually place in the wrong spot.