The freedom to push your computer well beyond the factory clocks is the best part of PC gaming. Whether you like to manually boost clocks to your liking or let the dynamic boost do the work for you, you need to keep a check on your hardware performance to ensure everything is working smoothly. This guide will show you how to monitor your gaming hardware performance using RivaTuner Statistics Server (RTSS).
What is RivaTuner Statistics Server?
RivaTuner Statistics Server was initially a companion to the RivaTuner open-source GPU overclocking tool designed for Nvidia GPUs, with limited support for ATI/AMD hardware. However, it’s now become a standalone tool offering hardware and frame-rate monitoring capabilities, with additional support for frame limiting and video capture.
It’s capable of monitoring:
- GPU temperature
- GPU usage
- CPU temperature
- CPU temperature
- Memory usage
- BUS usage
- Core and memory clocks
- No load, power, temperature, and voltage limits
- Framerate
RivaTuner itself has since been assimilated into virtually all major GPU overclocking tools, such as MSI Afterburner, EVGA Precision X, and ASUS GPU Tweak. RivaTuner can’t record hardware stats on its own; it needs one of these companion applications to fetch the data to display. We will be using MSI Afterburner for this guide, which bundles RTSS with it. Here’s what you need to do to get started.
Install and Configure RTSS
Start by downloading the latest stable release of MSI Afterburner bundled with RTSS.
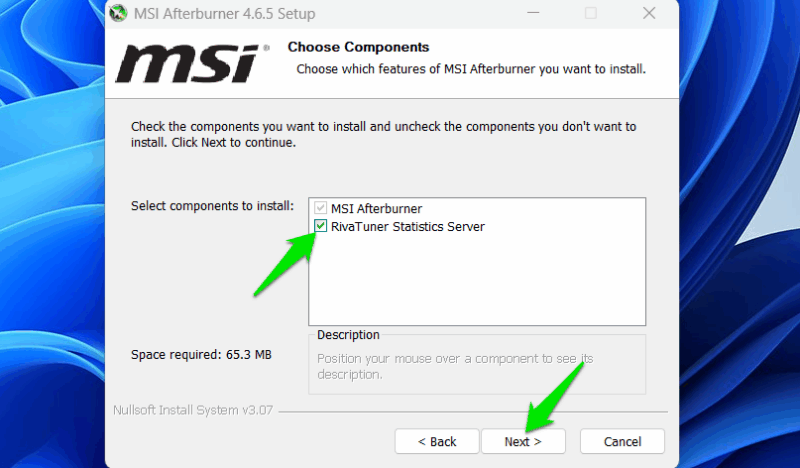
Install the tool and be sure to select RivaTuner Statistics Server when you are prompted to choose components during the installation. It’s not possible to monitor critical hardware parameters without RTSS.
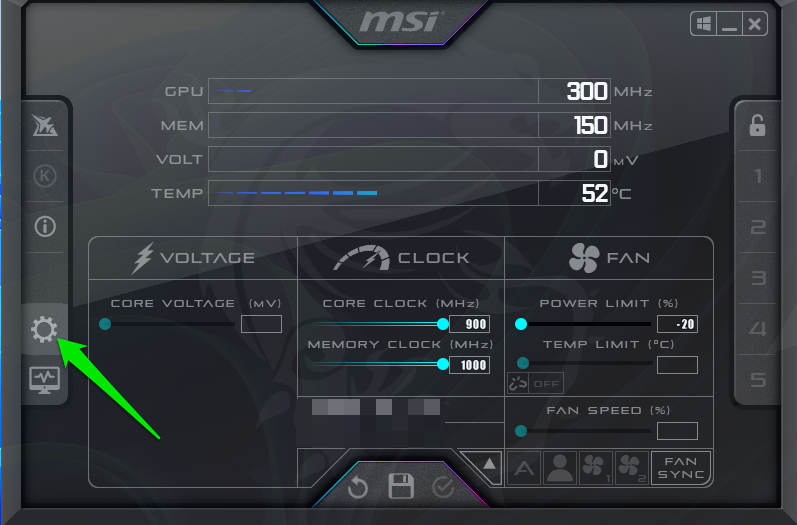
Open MSI Afterburner and dial in the overclock settings for the GPU. Alternatively, you can leave everything unchanged at the default settings and head straight to configuring RTSS by clicking on the Settings button represented by the gear icon.
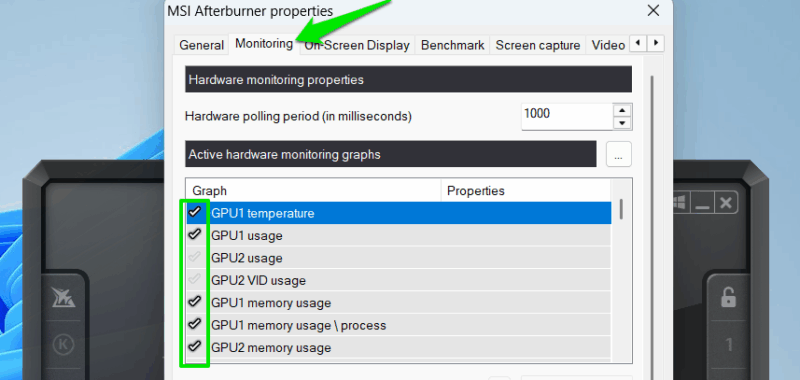
Navigate to the Monitoring tab in the Settings window. The tab contains a list of hardware parameters relevant to the CPU and GPU.
The checkmark next to each parameter suggests that MSI Afterburner is constantly monitoring the status of these parameters. For any parameter you want to track, you must first enable the checkmark to start logging data. The logging process uses some CPU resources, so you might want to disable parameters you won’t be tracking.
To display the recorded data on the screen, select the desired parameter to highlight it, tick the first checkbox below the list of hardware parameters named Show in On-Screen Display. The drop-down menu next to it allows you to choose whether you want this data displayed as text, a graph, or a combination of both. Repeat this procedure for all parameters you want to monitor.
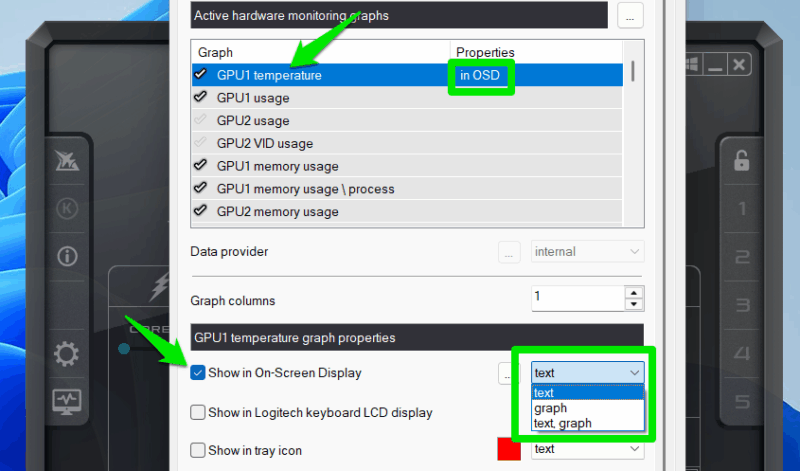
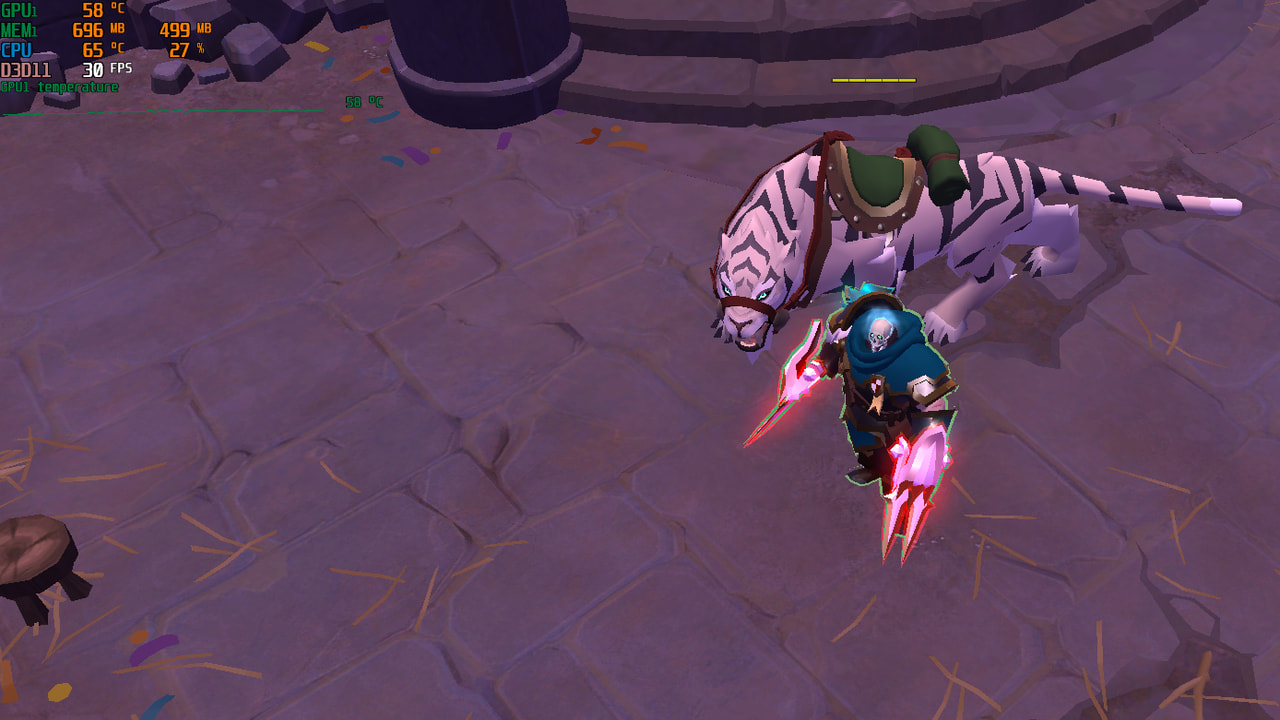
You can also set Alarms for minimum and maximum values, even without displaying the parameter data on the screen. When you are done configuring, click on the OK button to save these settings. The next time you run a game, the selected parameters will be overlaid on the top left of the screen.

Customize RTSS
Whether you’ve opened RTSS with MSI Afterburner or separately, you can customize a lot of things with RTSS itself. Open the separate RTSS app either through the system tray or by navigating to the executable on your PC. (You can also search for “rivatuner” through the Start menu.)
You’ll see plenty of options in the Rivatuner app, such as starting it with Windows, the dimensions of the OSD (on-screen display), and so on.
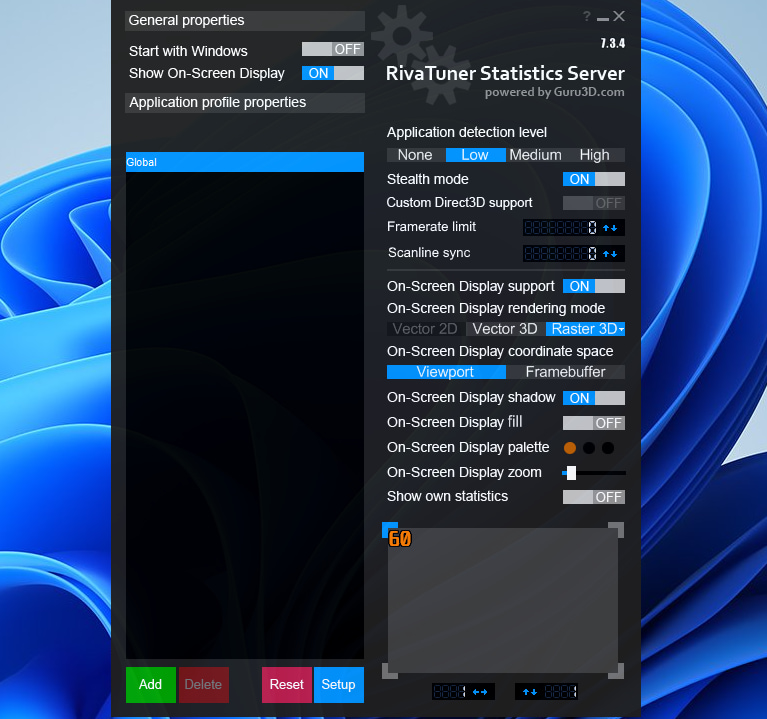
One of the more interesting features here is that if you click Add at the bottom-left corner, you can add RTSS profiles for specific programs and apps. It’s a great way to add custom profiles for individual games.
It’s very important, as many games will require different RTSS settings to work properly. For example, games with anti-cheat programs like BattlEye or Vanguard will require Stealth mode to be enabled to avoid false positives. Some games may also require a different OSD rendering mode.
There’s a lot here, so have a play around and do some customizing!
Using RTSS to Monitor Hardware Performance
RTSS comes with a long list of features and capabilities, but we’re primarily interested in the capability to monitor hardware parameters to improve the gaming experience. That involves keeping an eye on numerous statistics involving thermal, utilization, power, voltage, and clock speeds for the CPU, GPU, and memory subsystems. The following lays out the parameters you should take note of.
GPU Temperature
Keeping an eye on GPU temperature relative to the ambient temperature gives a good idea of the overall health of the cooling system of your graphics card. An overheating GPU is a sign that remedial measures such as GPU heatsink cleaning and thermal paste reapplication are required. Monitoring the Fan Speed to verify proper operation, along with using aggressive fan profiles should also help.
Modern GPUs tend to take manual overclocking control away from users and instead base it on thermal headroom. Getting the most out of your GPU is no longer restricted to preventing thermal throttling, but to ensuring that the GPU runs as cool as possible. Case in point: both Pascal and Turing Nvidia GPUs provide loads of extra boost clock speeds with every five-degree drop in temperature. The Temperature Limit parameter is also a great means to know if your GPU performance is hit hard on account of thermal throttling.
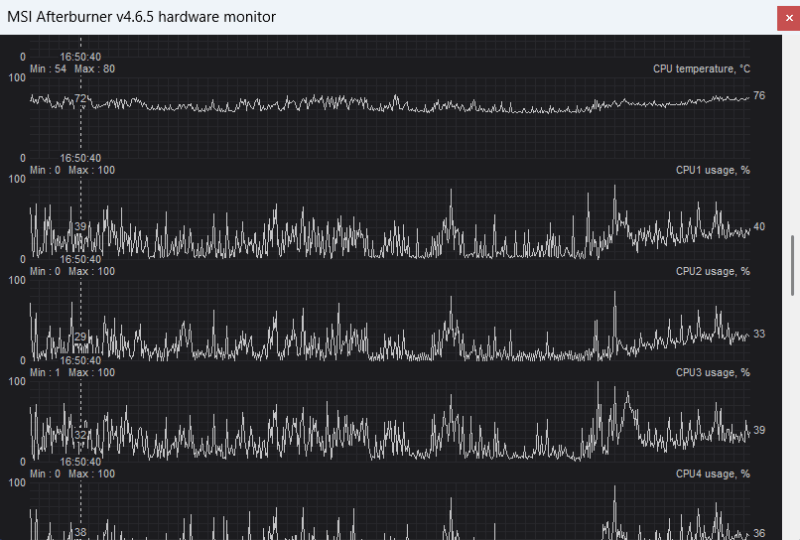
CPU Temperature
The same reasons apply to CPU temperatures as well. However, processor clock speeds aren’t as temperature-dependent as those of GPUs. Thermal throttling is what we are looking for here. Be sure to use the “CPU temperature” monitoring option. This is the accurate temperature for the whole CPU package on average. The temperatures with numbers like CPU1, CPU2, etc., are for individual cores.
CPU and GPU Usage
These parameters are extremely important. Depending on how optimized a game is, CPU utilization will range from 40 to 80 percent for most gaming rigs. However, if your CPU is at 100%, that means it is the weak link and bottlenecking the GPU. GPU utilization will be less than 100% in this case. You will get much better performance by upgrading to a more powerful CPU.
The converse holds true for the GPU as well. However, your GPU can hit near 100% usage under normal conditions as well. GPU usage fluctuates depending on the game’s demand. If it’s constantly near 100% while you aren’t getting the desired performance, it’s not good enough for the purpose.
Memory Usage
This refers to the video memory (VRAM) and shouldn’t be confused with the RAM Usage option, which pertains to the main system memory. Certain game settings, such as shadow quality, ambient occlusion, multi-sampled AA, and anything that uses normal maps, will require extra VRAM. Once VRAM usage exceeds the max installed memory on your GPU, the framerate will drop catastrophically as it resorts to system RAM or storage.
Some games, such as Alan Wake 2 or Cyberpunk 2077: Phantom Liberty, with path tracing enabled, are known for their explicit warnings regarding potential VRAM bottlenecks if your GPU’s memory is insufficient for the chosen settings. However, for most other demanding titles, keeping a close eye on VRAM usage is critical if you experience sudden framerate drops and/or microstutters.
BUS Usage
Consider keeping an eye on this parameter if your framerates drop precipitously without any explanation. BUS Usage is the utilization of the PCIe bus, which is the interface governing the communication link between the CPU and GPU. If BUS Usage reads 100%, you’re looking at a problem with the PCIe bus.
If you have the older PCIe 3.0 x16 BUS, many GPUs can saturate it, and 100% reading means your GPU is more powerful. Otherwise, this can be caused by a number of factors, ranging from driver issues, incorrect BIOS settings, and even debris in the PCIe slot or an incorrectly-seated GPU, preventing optimal electrical contact between the GPU and the motherboard.
Core/Memory Clocks
Once you know the maximum clock speeds of your CPU/GPU core and memory, any discrepancies therein are signs that the components are either experiencing thermal throttling or facing underutilization due to other underlying problems or configuration.
This parameter also helps diagnose memory issues. Memory cooling on most GPUs is weak, so overclockers should watch memory clock speeds closely for signs of thermal throttling and dial down memory overclocks to prevent damage to the GPU.
No Load/Power/Temp/Voltage Limit
These nifty monitoring parameters are a godsend for diagnosing odd GPU/CPU behavior and performance issues. They tell you if GPU/CPU performance is hit due to one of these limits. Here’s what they mean:
- No load: this means the GPU is not under any load and is in power-saving state. It’s normal when not running heavy games. However, if it shows up when playing a game, it means something is wrong. For example, this often happens in a dual-GPU setup where the game isn’t using the dGPU.
- Power limit: if it’s at maximum, it means your GPU is reaching the maximum power it’s allowed. If not, it means you still need to do some tinkering to get the best performance.
- Temp limit: mainly to catch performance drops due to thermal throttling. If your PC temperature is high enough to cause throttling, this parameter will let you know.
- Voltage limit: it’s the voltage that is allowed to the GPU/CPU, and it can be a limiting factor for performance, even when the GPU/CPU can utilize more power. For example, when we undervolt the CPU using Throttlestop, it limits the voltage to achieve it.
These Limit indicators are relevant to overclockers. Hitting these limits is a sign that your GPU or CPU is being throttled because of one of these limiters and needs to be addressed accordingly.
Keeping an eye on your hardware performance gives you a fair idea of the overall health of your system, which is critical to diagnosing any performance issues and underlying hardware troubles in time and without much heartburn. For more tips to monitor hardware performance, see our guide to stress-testing your GPU using Furmark, as well as stress-testing your CPU using Cinebench. Also, here’s how to stress test a graphics card on Linux.