Managing Docker containers from the command line works well when you’re comfortable with terminal commands. However, as your projects grow, or when you have multiple services in a homelab, you might need a tool that can simplify the management of your containers. This is where Dockpeek becomes useful. It’s a lightweight, web-based dashboard that allows you to see which containers are running, check their logs, monitor their status, and perform common actions all through a simple visual interface. In this guide, you’ll learn how to use DockPeek to view and manage all your containers at a glance.
Why You Should Use Dockpeek to Manage Your Containers
Many Docker dashboards exist, but most try to do everything, including container management, orchestration, and monitoring, which often requires complex configurations. Dockpeek takes a different approach by keeping things simple. Its main goal is to show all running containers and provide clickable links to access them instantly.
Once installed, Dockpeek automatically detects containers on your Docker host, reads the ports they expose, and displays everything in a clean, organized dashboard. This means you no longer have to remember port numbers or manually create bookmarks. For example, if a container runs on port 8090, Dockpeek simply shows a link to it. Clicking the link opens the application immediately.
Overall, Dockpeek centralizes all your containers in a single interface, helping you save time, avoid errors, and manage multiple services more easily. Developers and homelab users running several containers can gain quick visibility and full control, all without dealing with complex setups.
Setting Up Dockpeek with Docker Desktop
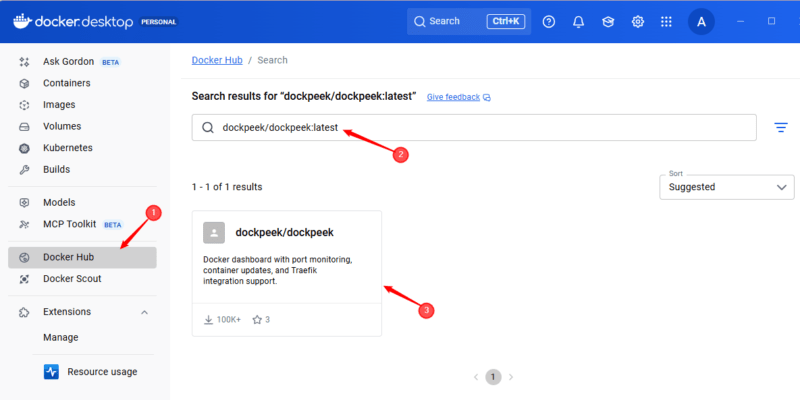
Dockpeek can be set up in several ways, such as using Docker Compose, the docker run command, or the Docker Desktop interface. Here, I’ll use the Docker Desktop GUI method, which is simple and does not require running commands in the terminal. To do this, open the Docker Hub tab in the left sidebar of Docker Desktop and search for dockpeek/dockpeek:latest. Then select the official image to download it.
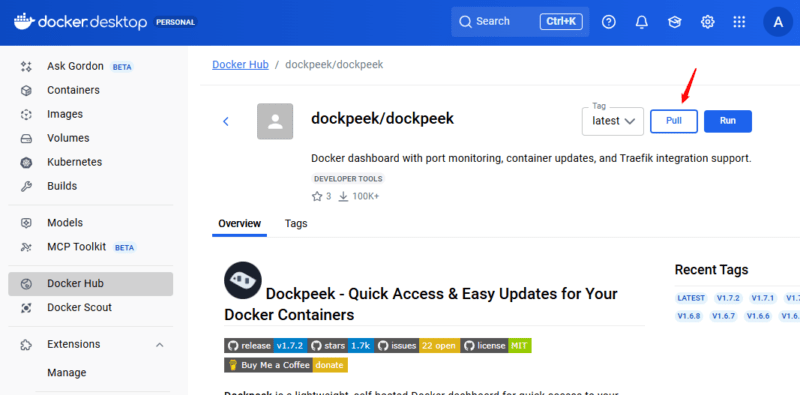
Now click the Pull button to download the image:
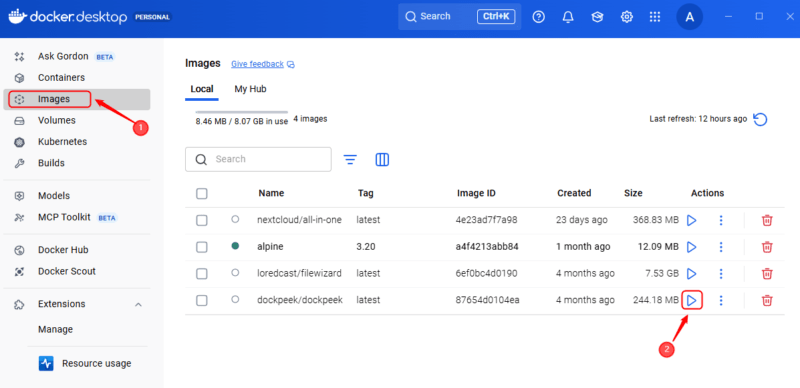
After the image is downloaded, you can create the container. For this purpose, navigate to the Images tab, locate the dockpeek/dockpeek image, and click Run.
In the configuration window, add the container name, port mapping, and other environment variables.
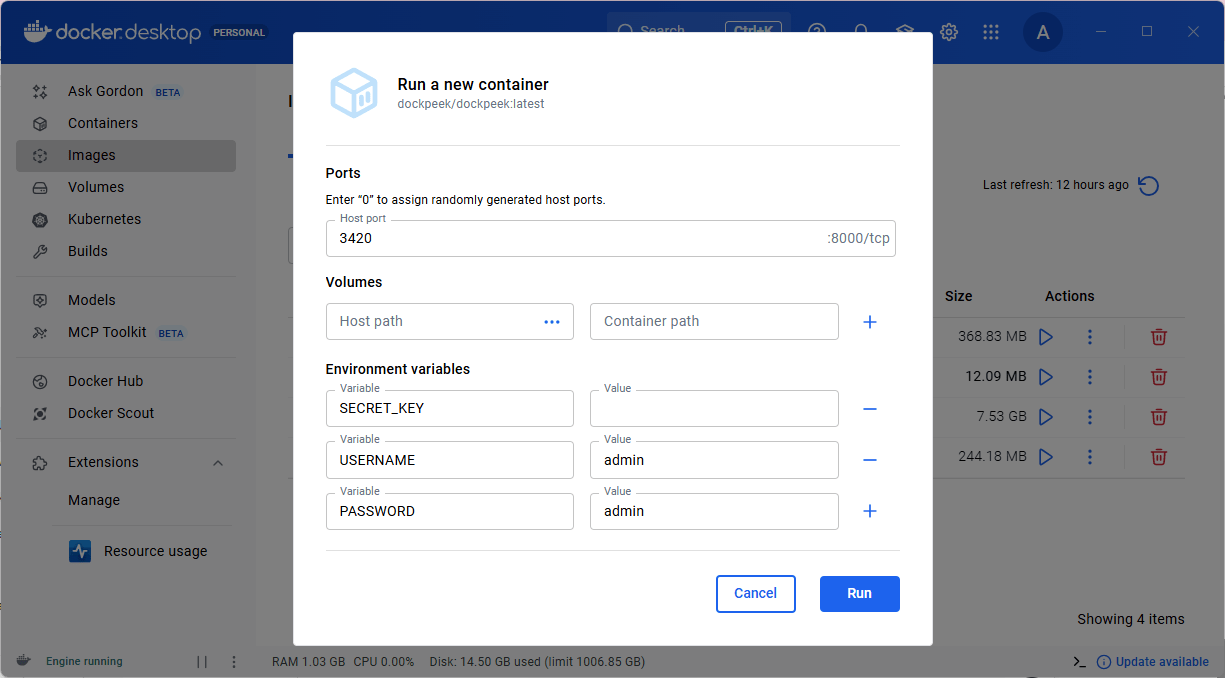
Note: You can define multiple Docker hosts using environment variables like DOCKER_HOST_1_URL and DOCKER_HOST_1_NAME, allowing the dashboard to connect to and display containers from all configured hosts.
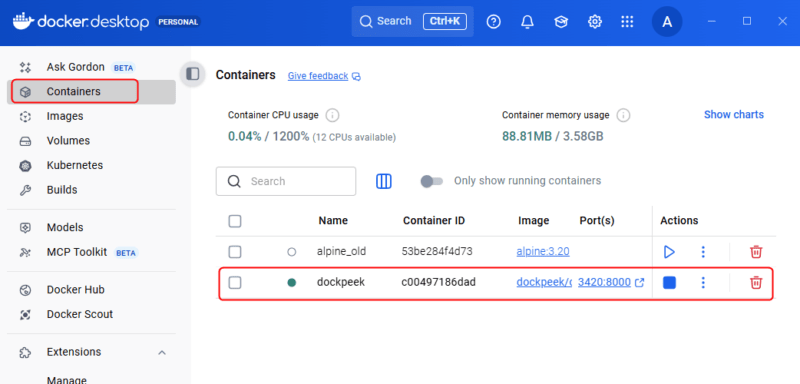
Click Run to start the container. You will see it listed in the Containers section.
No Complex Configuration
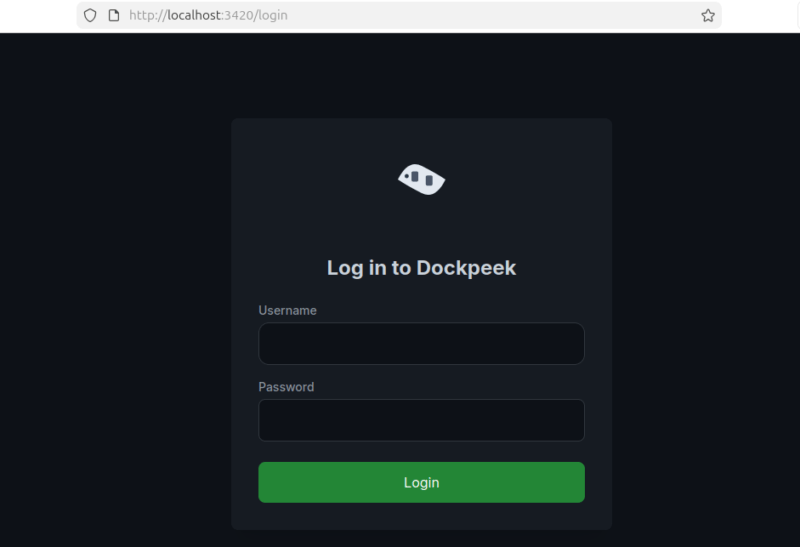
One of the biggest advantages of Dockpeek is its zero-configuration setup. After deployment, you can open your web browser and go to http://YOUR_SERVER_IP:3420 to access the Dockpeek web interface. If you are using Dockpeek on the same computer where it is installed, you can simply use http://localhost:3420.
Once the page loads, log in using the default credentials: the username is admin, and the password is also admin. It is recommended to change them immediately after the first login to prevent security issues.
Instant Visibility Into Your Containers
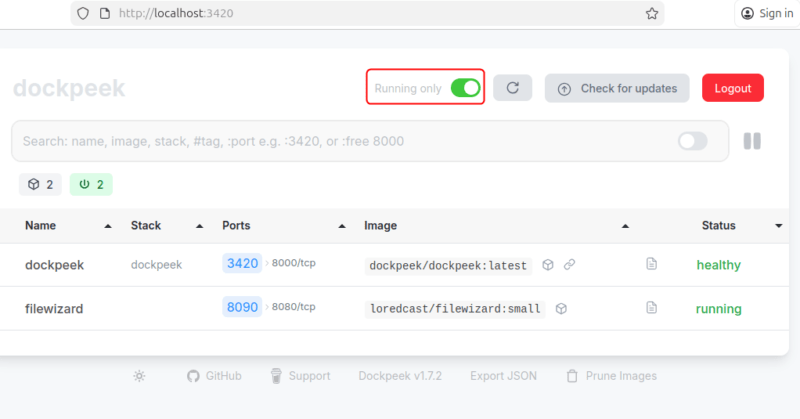
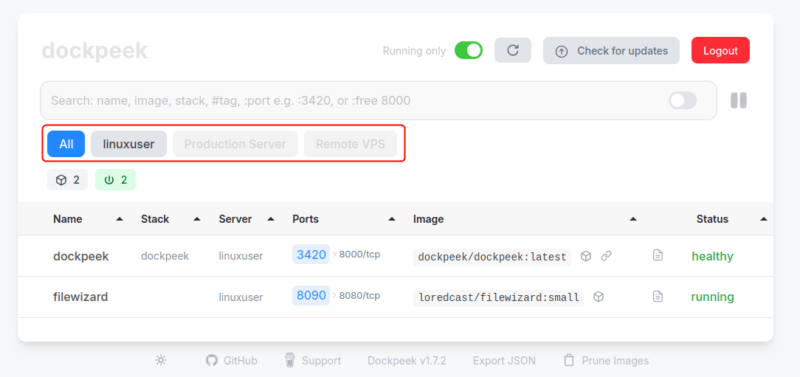
The moment Dockpeek starts, it scans your Docker environment and lists every running container. Each entry shows the service name and the ports it exposes.
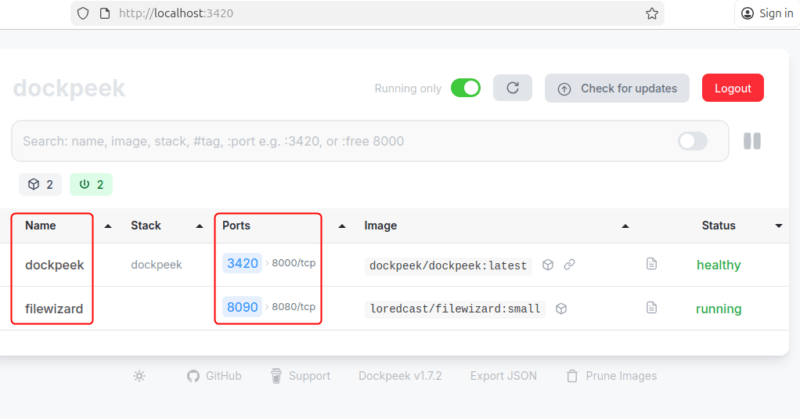
This provides a quick overview of your entire stack. Instead of searching for ports, you simply open Dockpeek and click the service you need.
Searching and Filtering Containers
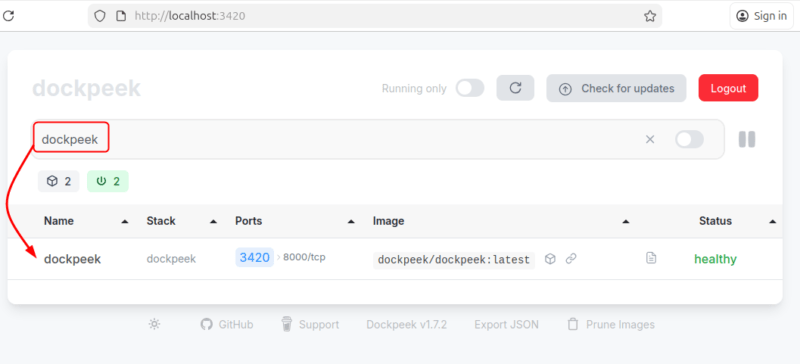
Dockpeek also makes it easy to locate and organize containers when you have many running on your system. The dashboard includes a search bar that allows you to quickly find containers by typing their name, image, stack, or port, which saves you from scrolling through long container lists.
In addition to searching, you can filter containers based on their status. For example, enabling the Running only toggle shows only active containers, helping you focus on services that are currently running while hiding stopped ones.
Dockpeek also supports filtering with tags and labels. Containers can include labels such as dev, staging, or production to indicate the environment they belong to. Similarly, project labels like webapp, database, or cache can be used to group containers that are part of the same application. Dockpeek reads these labels directly from Docker and displays them in the dashboard.
One-Click Refresh
Containers frequently start and stop during updates or testing. Dockpeek includes a refresh button that updates the dashboard instantly so you always see the current state of your Docker stack.
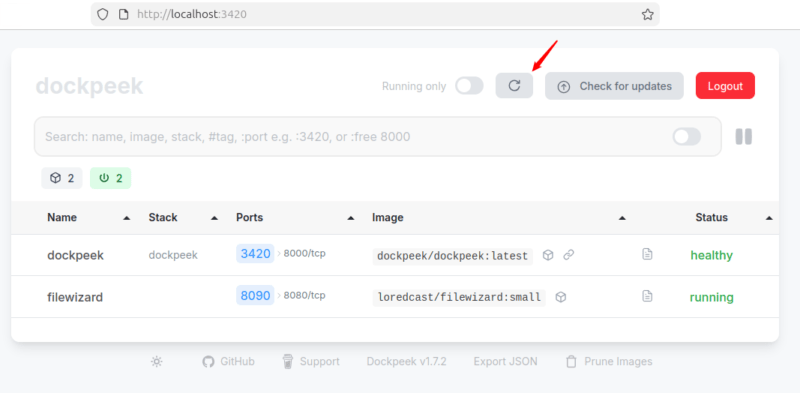
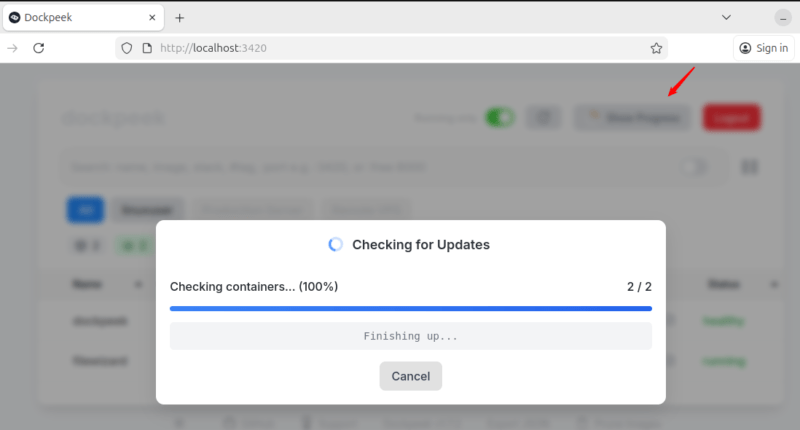
Image Update Indicators
Another helpful feature is the ability to detect container images that have newer versions available. This makes it easier to spot services that need updates and maintain a secure and up-to-date environment.
Automatic HTTP and HTTPS Detection
Another standout feature of Dockpeek is that it intelligently detects whether a service should be accessed through HTTP or HTTPS. It analyzes the container ports and generates the appropriate link automatically. This saves time and reduces connection errors.
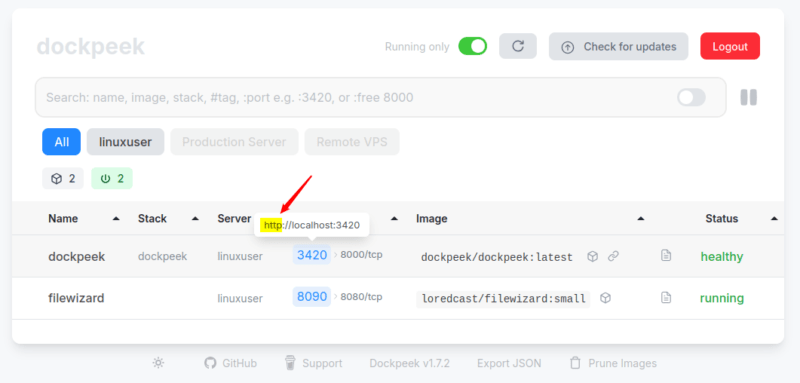
Managing Multiple Docker Hosts
Dockpeek lets you manage containers on multiple Docker hosts from a single dashboard. You can add different Docker hosts by providing their API endpoints, switch between them easily, and monitor or control containers on each host without logging in to them individually. This feature is especially helpful for homelabs or setups with several servers.
Apart from this, Dockpeek lets you remove unused images and personalize the dashboard for a cleaner experience. It combines simplicity, real-time monitoring, and multi-host management in a lightweight tool that’s easy to deploy and use.
You can also explore other Docker tools to see which fits your workflow best. For full dashboards and monitoring, Portainer is a good option, while WhatsUp Docker helps you track container image updates and know when to upgrade them. Trying a few tools can help you find the one that works best for your setup and needs.