Grafana is a powerful, self-hosted tool that turns complex metrics into clear, interactive dashboards and real-time charts. The best part is you can install Grafana on multiple platforms via Docker, which makes the setup quick, clean, and platform-independent. In this guide, I’ll walk you through installing Grafana using Docker and show you how to use it to monitor system metrics and visualize real-time data effectively.
Install Grafana Using Docker
Before installing Grafana, make sure Docker is installed on your system.
To get started, proceed with the following command to pull the Grafana image:
sudo docker pull grafana/grafana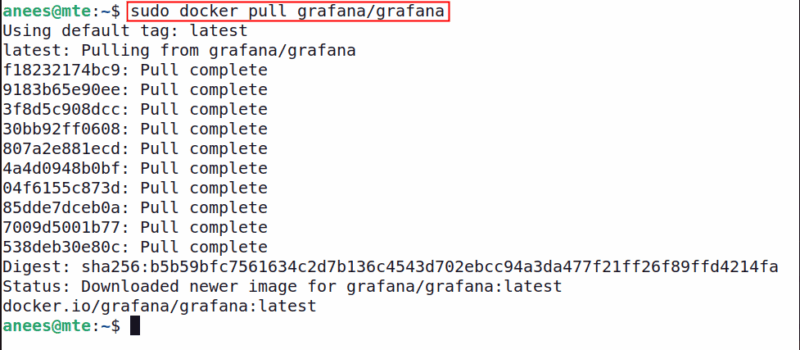
Now start a new Grafana container in the background and map it to port 3000 using the following command:
sudo docker run -d -p 3000:3000 --name=grafana grafana/grafana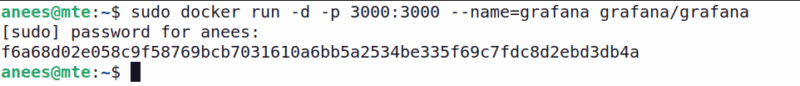
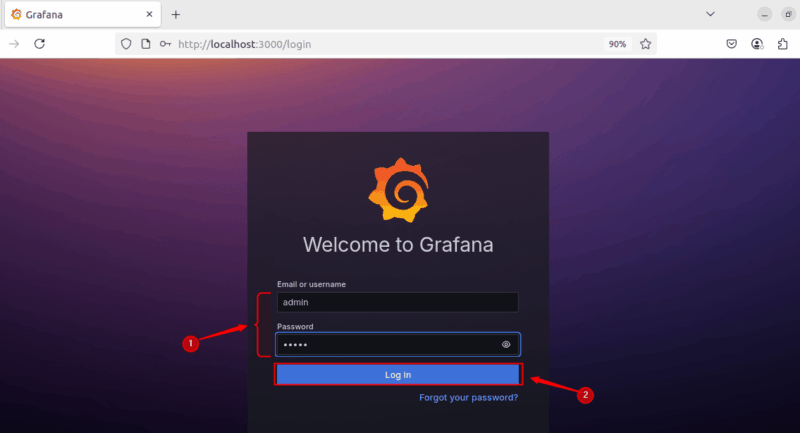
After running the Docker container, open your browser and go to http://localhost:3000 to access the Grafana dashboard. Use the default username and password, both set to admin, to log in to Grafana:
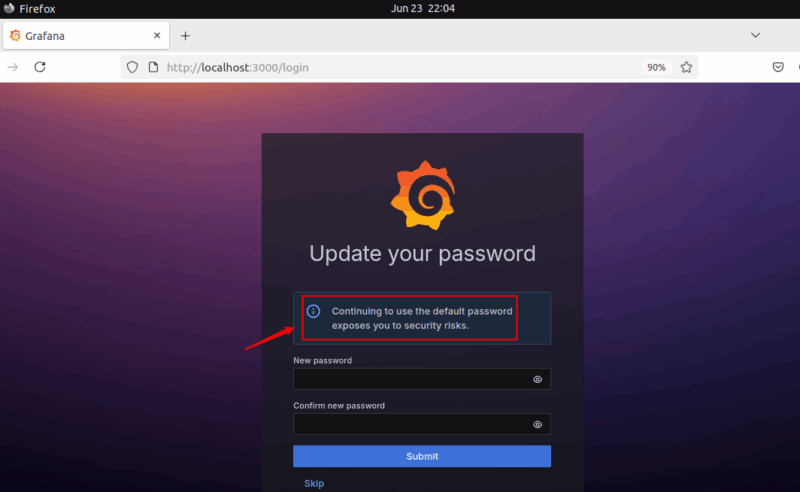
Once you hit the login button, it prompts you to update the password to avoid security risks. You can update and submit (recommended) the modified password or skip it to proceed with the default one:
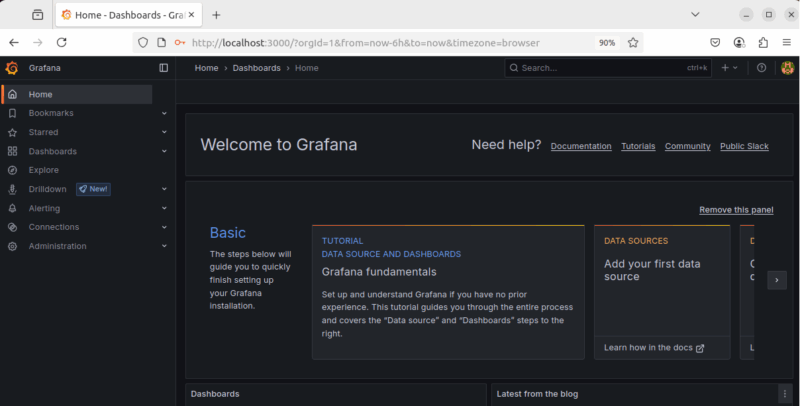
Once you’re successfully logged in, the following dashboard appears:
Related: other than Grafana, you can also use any of these tools to monitor your Linux system.
Connecting Data Sources and Visualizing Metrics
Grafana allows you to monitor various services and containers from a single dashboard. You can add multiple data sources (like Prometheus, MySQL, MongoDB, etc.) and visualize data using prebuilt or custom dashboards.
Let’s connect Prometheus as our first data source. To do this, we’ll install and run Prometheus using Docker:
sudo docker pull prom/prometheus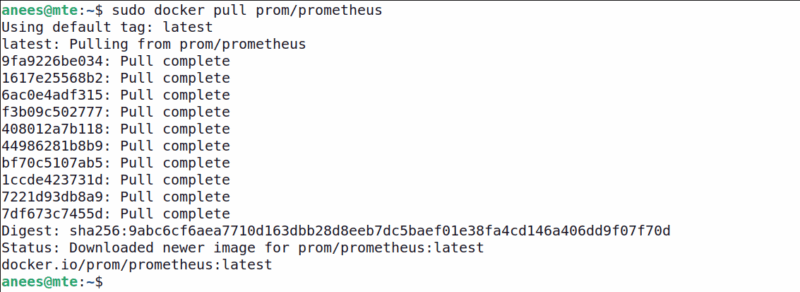
Run the Prometheus container with the following command:
sudo docker run -d -p 9090:9090 --name=prometheus prom/prometheus
Once the container is running, you can access the Prometheus web interface by visiting http://your_ip:9090.
Add a Data Source
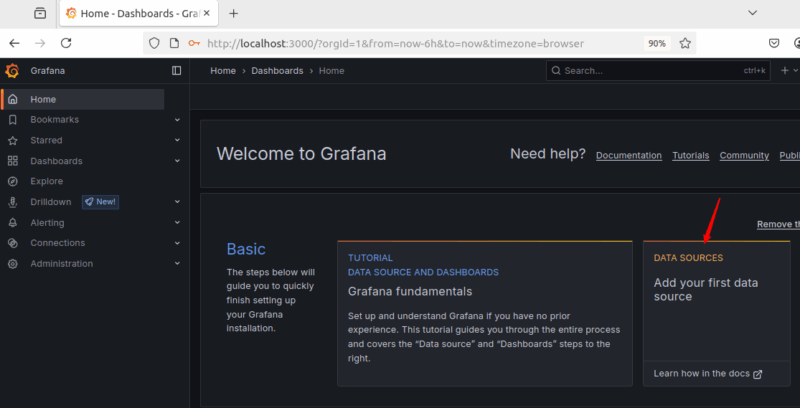
Now that Grafana and Prometheus is up and running, you can start by adding your first data source:
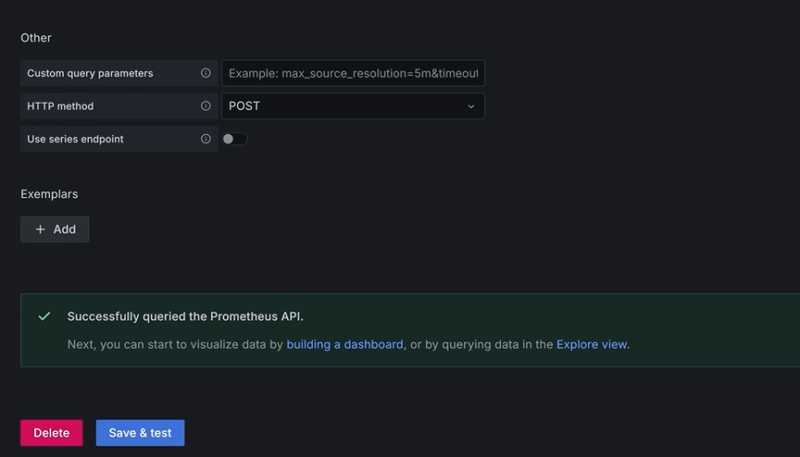
Select the datasource that you want to add, and then enter the URL, such as http://your_ip:9090. After this, click Save & Test, and you will be notified with the following message: Successfully queried the Prometheus API
Creating Your First Dashboard
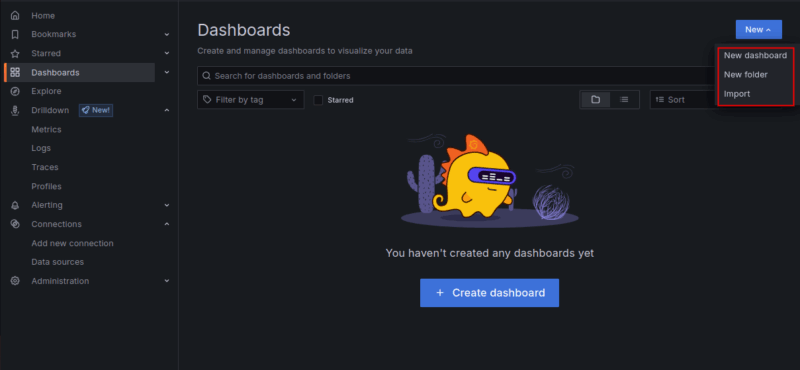
Once connected, you can create a dashboard to visualize your metrics using graphs, charts, and other panels. To do this, click on the Create Dashboard button or New -> New dashboard.
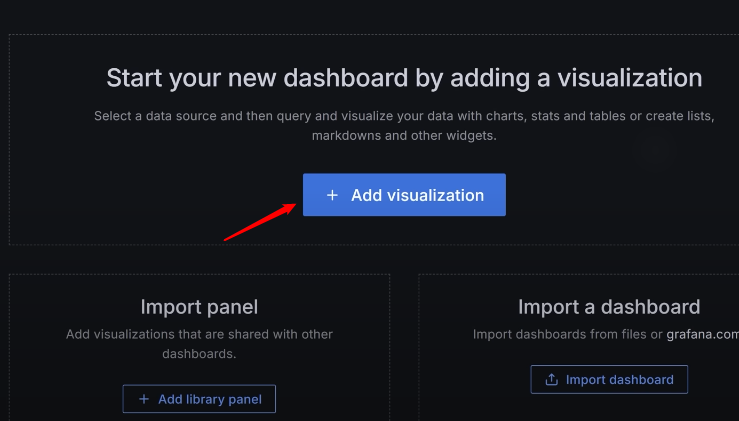
Now, click the + Add a new visualization button to start your new dashboard by adding a visualization:
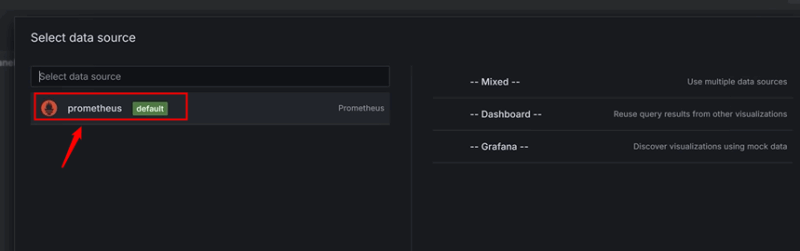
Finally, choose Prometheus as the data source:
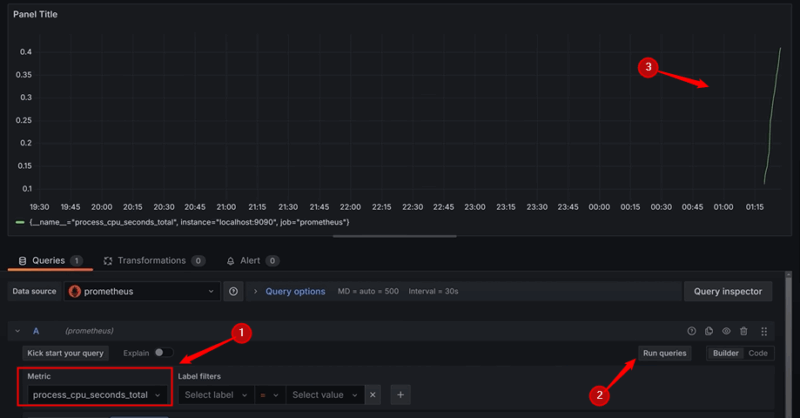
Use any available metric, e.g., process_cpu_seconds_total, and click the Run Queries button to visualize the data:
Similarly, you can add more visualizations (like CPU usage, memory, etc.) and drag and drop them into your layout.
This way, you can build a real-time, interactive view of your system or application data for easier monitoring and analysis.
Use Pre-Built Dashboards
Grafana allows importing community dashboards. For example, you can visit the official Grafana website and use any pre-built dashboards:
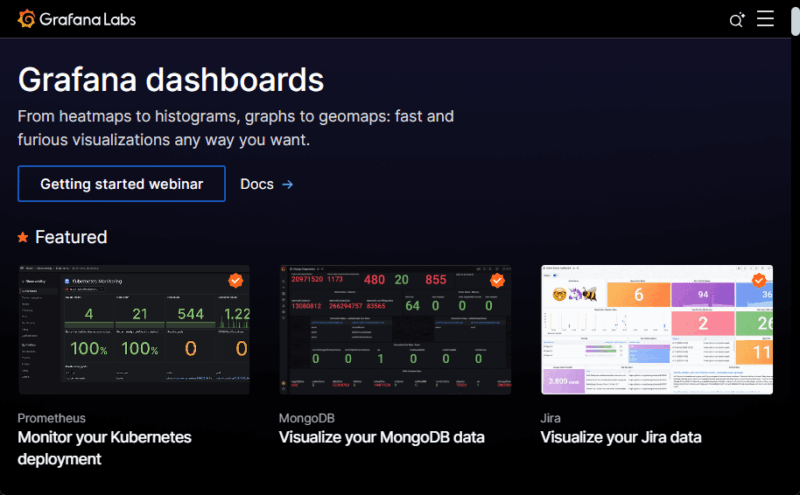
To use a pre-built dashboard, you can copy the ID of any dashboard from the official site and paste it into the Grafana dashboard section.
Now that Grafana is up and running, the next step is to explore advanced visualizations, install useful plugins, or integrate it with tools like Prometheus, MySQL, or Elasticsearch for a complete observability stack. You can also explore how to run other GUI-based applications in Docker to create a more interactive and flexible environment.