Windows offers a deep bench of diagnostic tools, but the Reliability Monitor is the hidden gem that often gets overlooked. If you’ve ever wanted a “health score” for your PC that shows you exactly how it’s performing, this is it. Let’s see how this simple tool can help you pinpoint PC issues and keep your system running smoothly.
Reliability Monitor is a Powerful Diagnostic Tool
Reliability Monitor is a powerful diagnostic tool that provides a visual timeline of your PC’s stability, tracking software/hardware crashes, system-level changes, and system updates. Think of it as a streamlined version of Event Viewer for regular users, providing an executive summary of PC problems.
While it has been part of Windows since the Vista era, it has always been a lesser-known tool, as it’s hidden inside the Control Panel behind multiple menus. With Windows 10/11 moving away from the Control Panel, this tool is even more obscure now.
It’s great for quickly finding the cause of a problem when you face an issue. But more importantly, it gives a reliability score to your PC based on recent events, making it a great tool to keep a check on overall PC health.
Accessing the Reliability Monitor
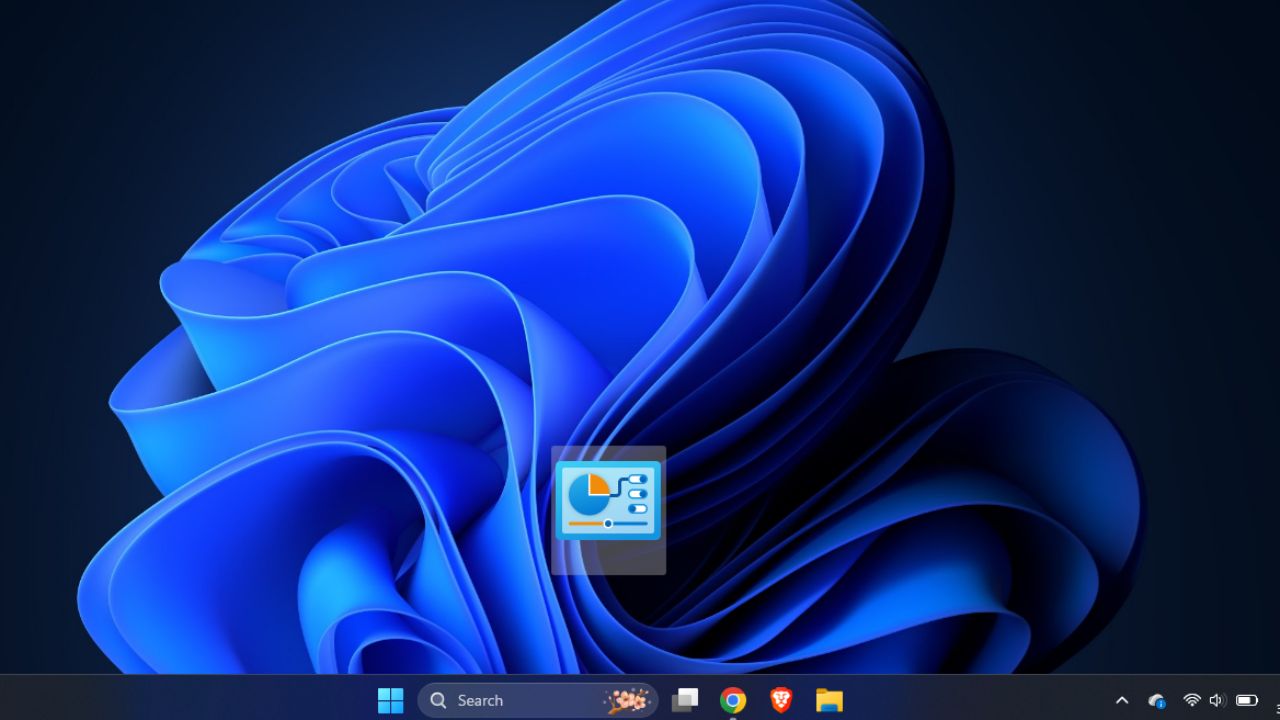
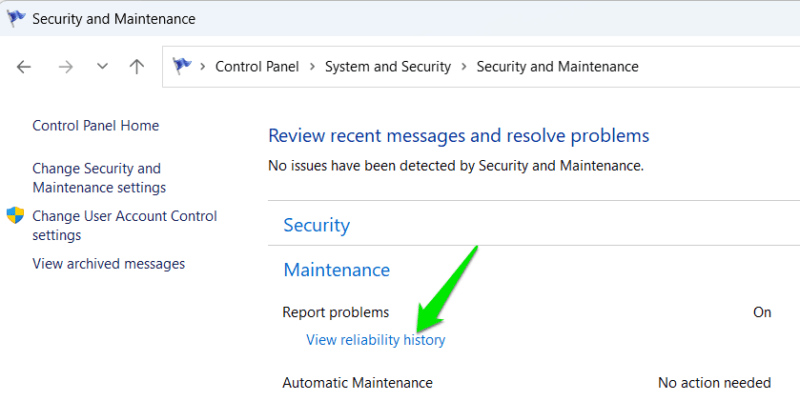
Reliability Monitor is buried deep inside the Control Panel. To access it, you’ll have to open the Control Panel and go to System and Security → Security and Maintenance. Here, open the Maintenance drop-down menu and click the View reliability history button.
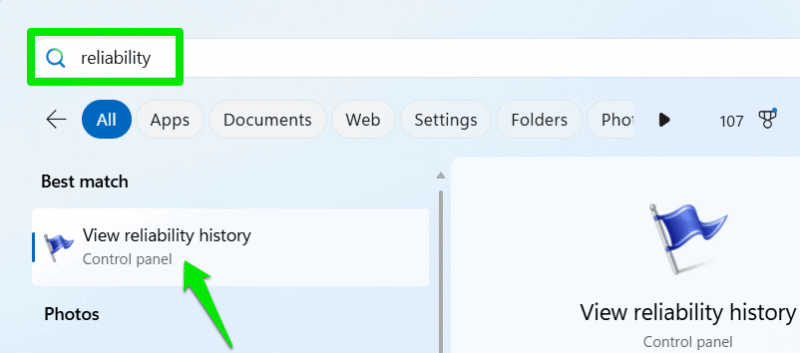
While that’s its official location, there are also easier ways to access it. The easiest one would be just typing “reliability” in Windows Search and clicking on the View reliability history control panel item. You can also press the Win + R keys and type perfmon /rel in the Run dialog to open it.
If you’ll be accessing this tool often in the future, you can also create a custom desktop shortcut and put perfmon /rel as its location.
Deciphering the Reliability Monitor Graph
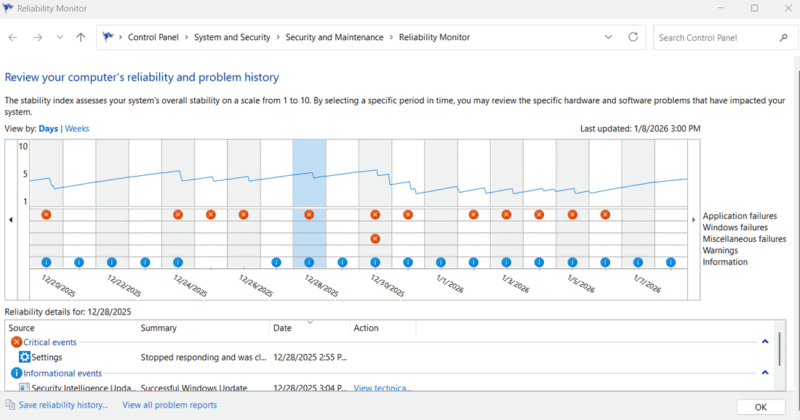
Reliability Monitor tracks PC events over the last 28 days and shows the state of each day on the graph. The graph has two main components: a blue score line and event icons. Below is the explanation of both:
The Blue Score Line
On the graph’s y-axis, there is a 0-10 score, which is represented by a blue line. This is your overall PC stability score, influenced by days of stability/instability. The line uses a weighted moving average, so it goes up or down based on the most recent events.
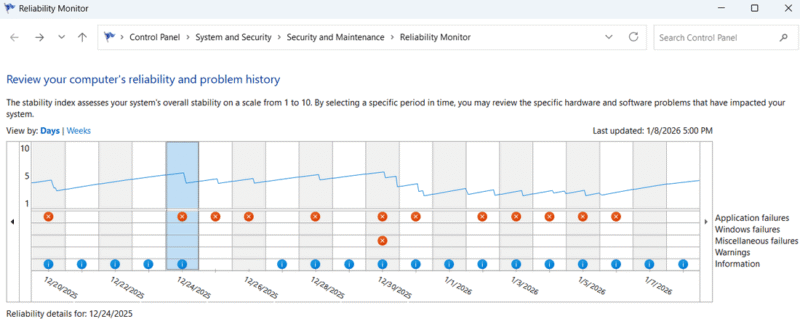
It isn’t realistic to reach for the 10 score, as a working PC will always face minor errors and app crashes. For most users, the score will stay between 5 and 7, with 8 being excellent. You should be concerned if the blue line stays below the 4 score consistently. Usually, it means a chronic issue like a failing driver, corrupted files, or hardware issues.
In my case, the score is hovering between 4 and 6, which is a bit concerning. But I know it’s because of a problem with the QuickLook app that generates a critical error report whenever I manually close it. So I don’t have to worry about anything.
The Event Icons
Reliability Monitor uses three icons to track health: a red ‘X’ for critical events (crashes), a yellow ‘!’ for warnings, and a blue ‘i’ for information (updates). These are grouped into horizontal rows by severity, letting you quickly distinguish between a minor software glitch and a major system failure.
Your stability score is primarily determined by critical events, though warnings can cause slight decreases in the score. While information events are neutral, they are very important to understand why a critical event happened. For example, if the log shows a driver update or app installation immediately before a critical error, you have likely found the culprit.
Learning More About Errors
While the graph shows stability at a glance, the details section below provides the specifics. Clicking any day on the graph reveals all events from that date, including the exact time, type, and a brief summary.
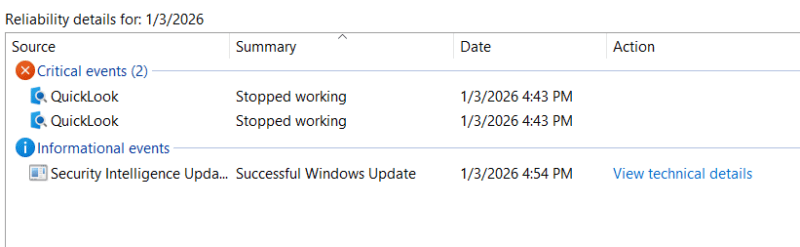
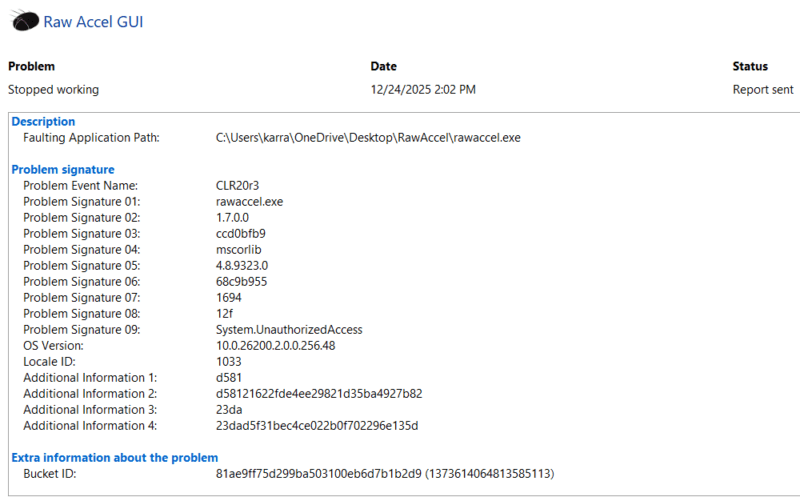
To dig deeper, click View technical details next to an entry. This page displays the specific error codes (like Exception Codes) that caused the crash. You can use the Copy to clipboard button to easily paste these details into a search engine or an AI chatbot to find a fix.
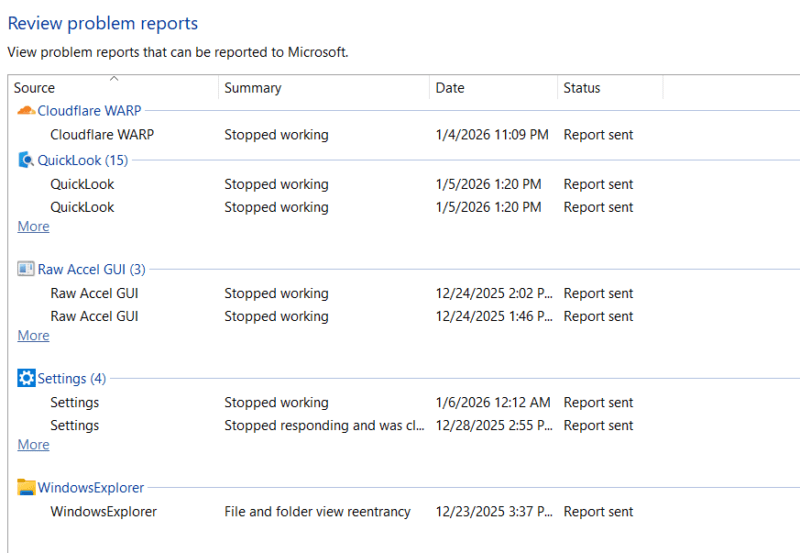
Finally, the View all problem reports button organizes every recorded issue into a sortable table. This makes it easy to spot apps that are repeatedly causing issues. Additionally, if you’ve recently fixed your PC and want a fresh start, the Clear all problem reports button will wipe the history and reset the Reliability Monitor.
Overall, Reliability Monitor is a great tool to view your PC’s stability report at a glance. Just make sure you correlate the errors with your overall score to see the full picture. If the Reliability Monitor reveals deep system issues, you can use these Windows system diagnosis commands to begin the repair process.