Being able to monitor the CPU and memory usage in Docker Desktop gives you a better understanding of how your containers perform, and how they affect your system’s performance. Docker Desktop provides various ways to track and manage these resources. Here, we show you how to monitor CPU and memory usage effectively in Docker Desktop.
Why There is a Need to Manage Resources in Docker Desktop
Docker Desktop runs containers inside a virtualized environment. On Windows, this may be Hyper-V or WSL2, and on macOS, it uses HyperKit. The virtual machine layer makes container behavior consistent across systems, but it also adds overhead. This means that both the container workloads and Docker Desktop’s own background processes can take up plenty of system resources.
To keep your computer responsive, Docker provides controls for CPU, memory, and disk. You can limit how many CPU cores Docker can use, set a memory cap to prevent containers from consuming all available RAM, and limit storage or run cleanup to remove unused images, containers, and volumes.
Knowing how Docker Desktop manages CPU, memory, and disk resources gives a clearer picture of where usage comes from. Sometimes heavy consumption is linked to a specific container. However, sometimes it results from Docker’s own background processes. This makes monitoring resource usage essential. It helps you track CPU and memory activity in Docker Desktop, identify what is consuming the most, and keep your system running smoothly.
Monitor CPU and Memory Usage Using Docker Dashboard
The Docker Desktop Dashboard offers a built-in, user-friendly interface for monitoring your containers. It’s the easiest way to check real-time CPU and memory usage without using command-line tools.
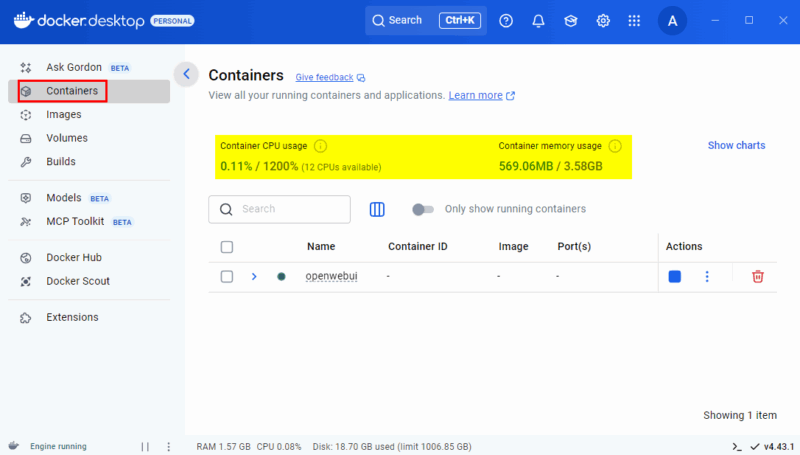
To keep track of how your containers are performing, open Docker Desktop and navigate to the Containers section. You’ll see each running container along with real-time CPU and memory usage. This helps you to quickly identify if a container is using too many resources.
For more details, you can click on any container to view its logs, environment variables, and running processes, including real-time details of its CPU, memory, disk, and network usage.
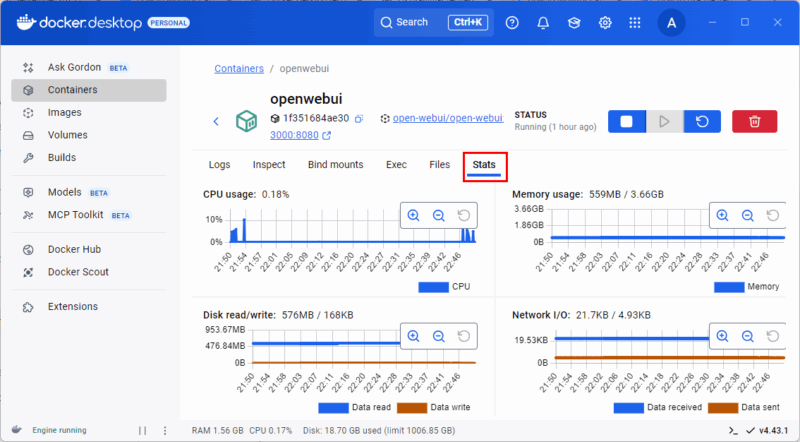
This makes it easy to spot performance issues or troubleshoot problems without any complex commands.
Enhance Monitoring with the Docker Desktop Resource Usage Extension
Another way to monitor container performance in Docker Desktop is by using the Resource Usage extension. While the built-in dashboard already shows CPU and memory usage, this extension takes monitoring a step further by giving you a dedicated dashboard with more detailed insights.
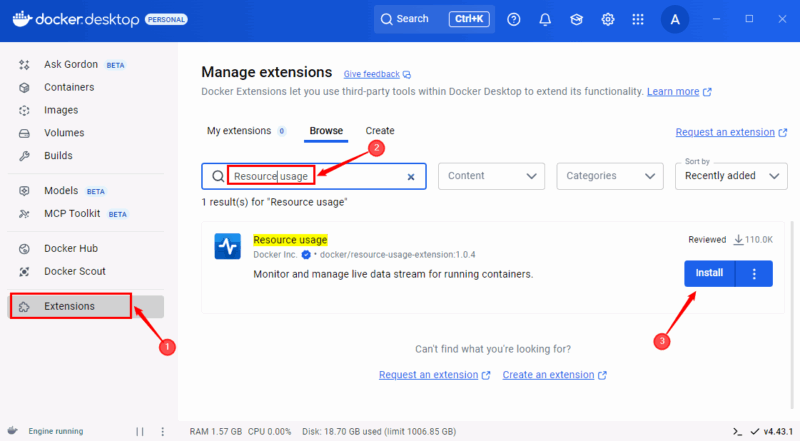
To install it, go to the Extensions section in the left sidebar of Docker Desktop, search for Resource Usage in the search bar, and click the Install button.
Once the extension is successfully installed, you can find it in the left sidebar of Docker Desktop. Click the extension icon to see a clear overview of each container’s CPU and memory usage, along with disk I/O and network activity. You can also filter and sort containers, making it much easier to identify which ones are consuming the most resources.
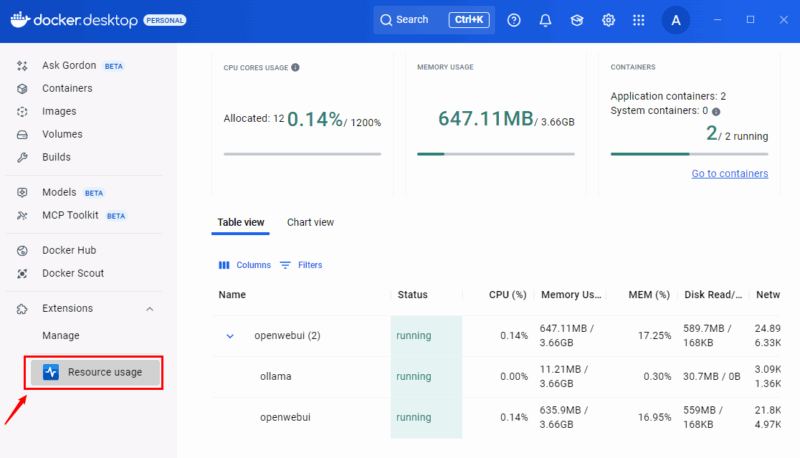
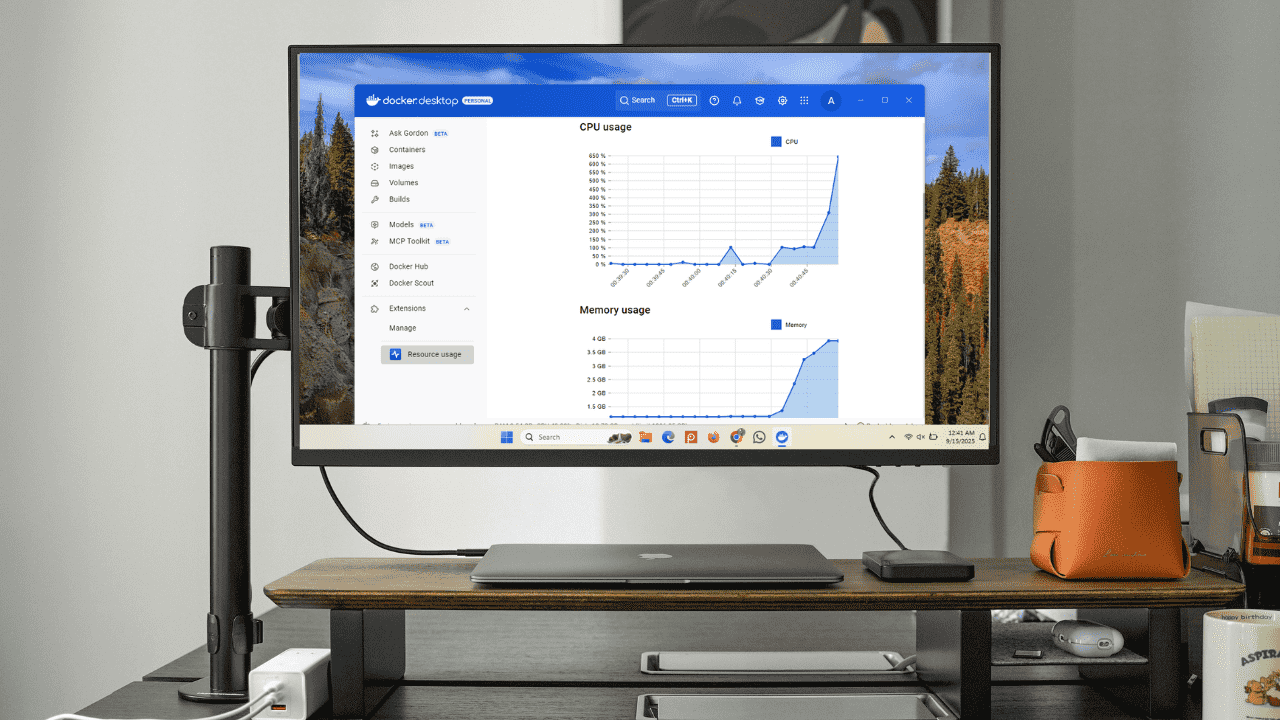
Moreover, you can navigate to the Chart View to see resource usage in graphs, which makes it easier to notice spikes or unusual activity in your containers.
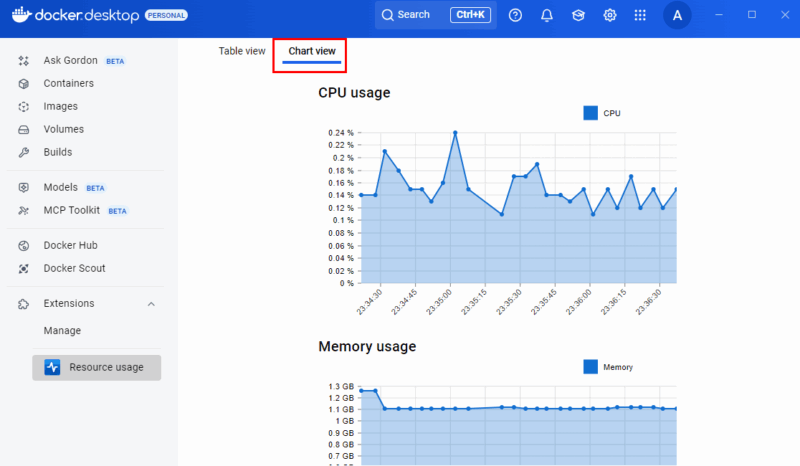
Overall, this extension makes monitoring simpler than the default UI. It helps you quickly spot performance issues and manage resources better, especially when running multiple containers.
Track Real-Time Resource Usage with the docker stats Command
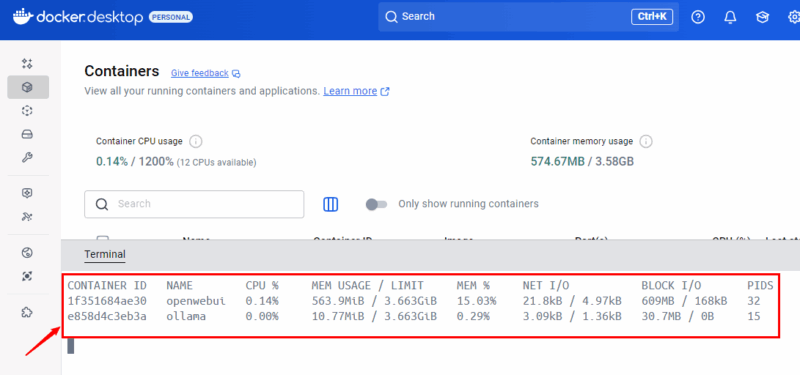
The docker stats command lets you track real-time CPU, memory, disk, and network usage of your containers from the terminal. You can open the terminal right inside Docker Desktop and run this command to monitor real-time resource usage for all your running containers.
docker statsWhen you run the docker stats command, it streams live container metrics like CPU, memory, etc. To stop the stream and return to the normal terminal prompt, you need to press Ctrl + C.
You can also target a specific container by adding its name or ID. For example, specifying the openwebui container in the command will show usage details only for that container.
docker stats openwebui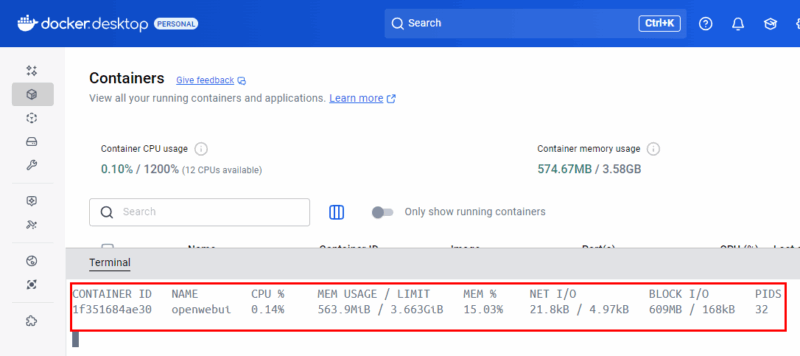
The docker stats command is useful if you prefer command-line monitoring over the graphical dashboard.
Wrapping up
Monitoring CPU and memory usage in Docker Desktop keeps your containers running smoothly and your system responsive. With tools like the built-in dashboard, the Resource Usage extension, and the docker stats command, you can track performance in real time, spot heavy resource users, and troubleshoot issues quickly. These features simplify managing container workloads, giving you clear insights and full control over CPU, memory, and disk usage while staying within Docker Desktop. For more advanced monitoring, you can also use tools like Portainer or Prometheus with Grafana.