The load average is an important metric in Linux that shows how busy the system is. It allows you to find out how much work the CPU is handling and whether the system is under heavy load. Unlike CPU usage, which reflects performance at a specific moment, the load average provides a broader view of system activity over time. In this guide, we’ll explain what Linux load average means, how it works, and how to monitor it effectively for better performance.
Understanding Load Average in Linux
Load average in Linux measures the number of processes either running on the CPU or waiting for CPU time. A load value of 0–1 may mean that it has no process running, or that all the processes run smoothly without having to wait for CPU time. When the value is more than 1, it means that there are more processes than the CPU core can handle, and some of the processes have to wait for prior processes to complete before they can run.
To account for the constantly changing system activity, Linux calculates the load average over 1, 5, and 15-minute intervals. Linux displays load average as three decimal numbers:
load average: 0.19, 0.10, 0.14Here, the first number indicates the average system load over the last 1 minute. The second value indicates the system’s average load during the past five minutes, and the third reflects the average load over the previous fifteen minutes.
These metrics allow the users to understand how their CPU has been utilized over time, rather than at a single moment.
Interpreting Load Average in Linux
To better understand the load average in Linux, you have to first find out the total number of CPU cores in your system.
On a single-core CPU, a load average of 1.00 represents full utilization (100%). On a dual-core CPU, this reflects about 50% usage, while on a quad-core CPU, it corresponds to roughly 25%.
Extending this principle to multi-core CPU, for a quad-core CPU, you should be concerned if the load average is consistently above 4, which means it is always running at 100% capability.
Check Load Average Using the uptime Command
The uptime command in Linux shows how long the system has been running, the count of active users, and the load averages recorded over the past 1, 5, and 15 minutes. To do this, run the uptime command in your terminal like this:
uptimeYou should see the load average (0.15, 0.15, and 0.04 in this case) over the last 1, 5, and 15 minutes respectively.
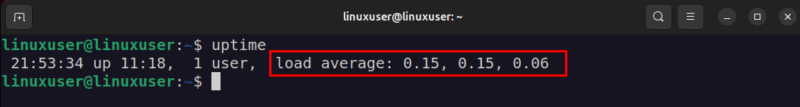
Here, the system load is very low, which means the system is performing efficiently without any strain on the CPU.
Monitor Load with the top Command
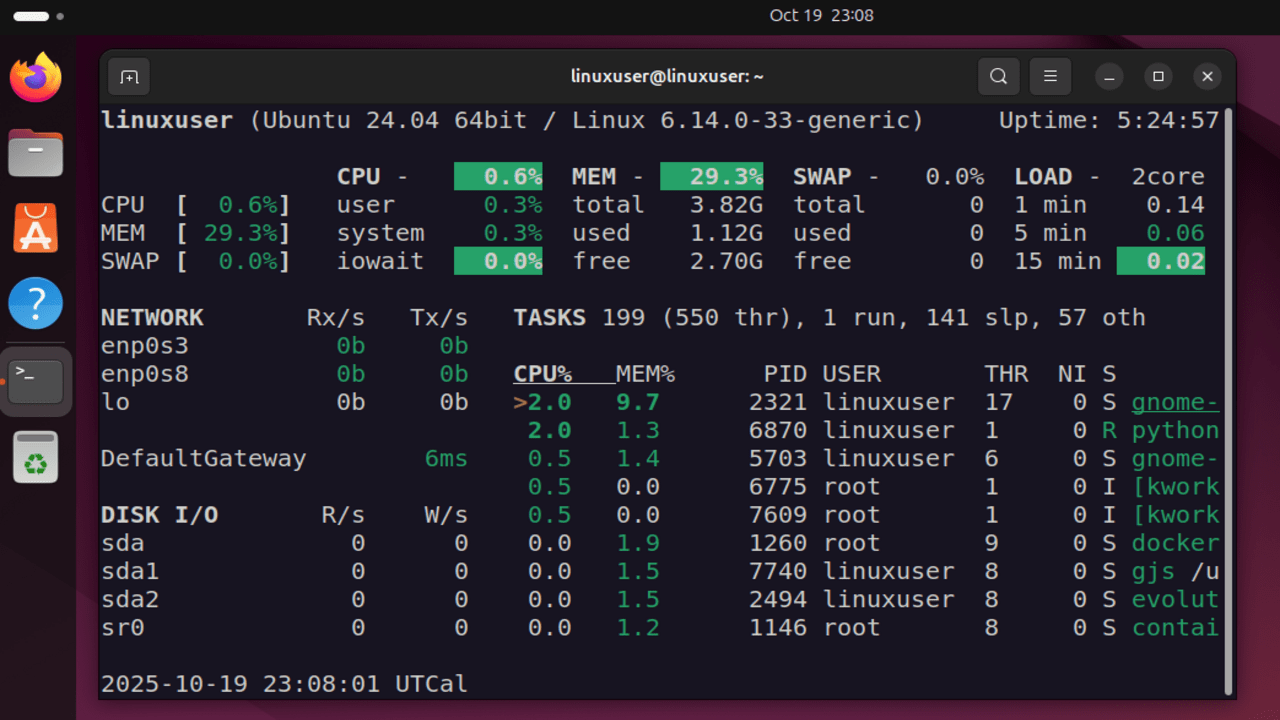
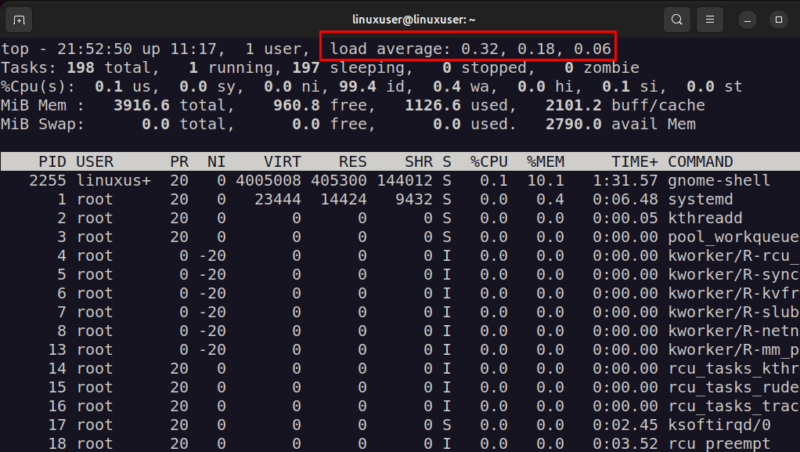
The top (or htop) command gives a real-time view of system performance, including CPU usage, memory consumption, and load averages. When you run this command, it continuously updates the display, showing active processes and their resource usage.
topIt shows the load average values for the last 1, 5, and 15 minutes in real-time at the top of the screen.
The good thing about the top command is that it runs continuously and updates the metrics in real-time, which is useful for monitoring your system for performance-related issues.
Other than top, you can also use the w command, glances tool, and these system monitor tools to monitor the Load Average.
Fixing High Load Average
When the load average exceeds the number of CPU cores, it means more processes are waiting to be executed than the CPU can handle at once. This situation indicates that the system is under heavy stress or overloaded.
Identify the Cause Using top
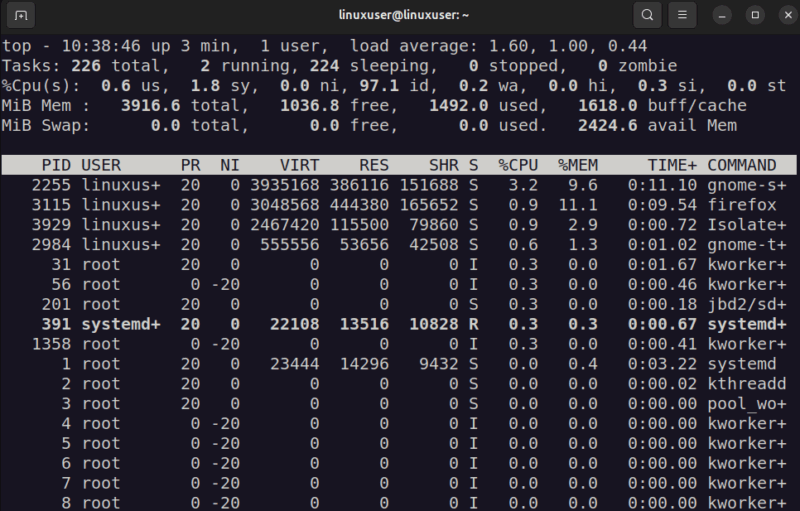
You can use commands like top, htop, or ps to identify the cause.
Here, the load average is slightly up, mainly because of recent startup processes like Firefox and GNOME Shell consuming system resources. The absence of swap space also adds minor delays, contributing to the higher load.
Reduce the Load
Once you identified the cause, you can fix it with:
- Stop unnecessary/crashed processes using the kill command.
- Close resource-heavy applications or limit the number of users accessing the system simultaneously.
- Add swap space to reduce memory pressure.
- Disable unwanted startup programs to lower the high load average.
You can also optimize active processes by adjusting their configurations. For example, reducing thread counts or buffer sizes, minimizing their memory usage, or lowering their CPU priority using tools like nice or renice. These adjustments help balance system resources and reduce overall load.
Check for Disk I/O Bottlenecks
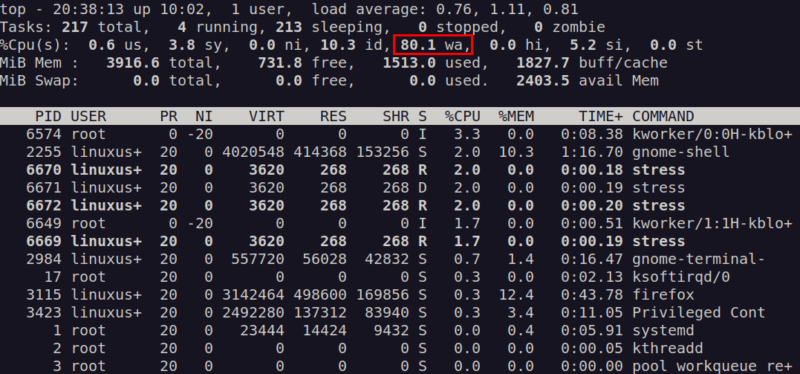
Disk-related bottlenecks can also cause high load averages. Run the top command and monitor the wa column (I/O wait). If disk utilization is high, consider upgrading to SSDs, spreading data across multiple disks, or optimizing disk-heavy applications.
Manage Cron Jobs Efficiently
Running multiple cron jobs simultaneously can overload the system. You can check for overlapping jobs using the grep CRON /var/log/syslog command. You can spread out their run times so they don’t all start at once. Another option is to use a time-based job manager like Anacron, which automatically runs missed jobs at less busy times.
Handle Stuck Processes
If the load remains high because of unresponsive processes, try identifying and stopping them manually. A reboot can be a temporary fix, but always find and resolve the root cause first.
Finally, Docker or Kubernetes can help isolate and manage workloads, ensuring one service doesn’t overload the entire system.
Final Thoughts
Monitoring the load average in Linux helps you decide when your system is performing well or needs optimization. Tools like uptime, top, and glances make it easy to track CPU activity and detect performance issues early. If the load average stays consistently higher than your CPU core count, it’s time to optimize processes, schedule tasks efficiently, or upgrade hardware. Regularly checking the load average ensures better system performance, improved efficiency, and stability under demanding workloads.