
Wouldn’t it be great if you could know which areas are safer for you to visit with regard to the coronavirus? You could research it yourself and spend a little bit of time, or you could just automatically have the information on the map you’re already using. Google Maps has added a layer that shows the severity of COVID-19 in different locations.
News Google Coronavirus Features
Google has been adding new features to its products throughout, since the onset of COVID-19, and much of the updates have been made to Google Maps.
It’s easier for business owners to update their business hours, and restaurants that deliver and medical locations are now highlighted. Groups are allowed to create their own maps, and locations not respecting lockdown restrictions are shown as well.
Now Google Maps is adding a layer that will show the severity of the COVID-19 outbreak on the map. It can help you in travel-planning and also help you get immediate information about the area where you live and/or work, shop, or visit family members.
COVID-19 Layer on Google Maps
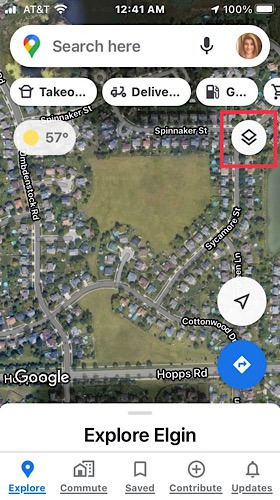
When you open Google Maps and are looking up an area to visit or where you are currently located, there is a layers button toward the upper right of the screen. Tapping that provides you with several options. One of those options is “COVID-19 info.”
This adds a layer to the map you are looking at that shows a seven-day average of the number of new virus cases per 100,000 people. In addition to this is an arrow that shows whether cases are currently increasing or decreasing.
In addition to the number and increasing/decreasing information, different areas are color-coded to help you quickly distinguish the severity of the area at a glance.
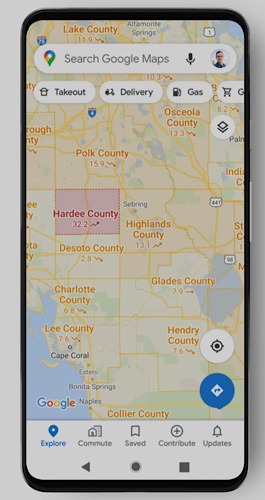
This data is visible at the country level for all 220 countries and territories that are supported by Google Maps. Also shown are state or province data, county data, and city data where available. You can see in this map of Florida below that the severity in Hardee County is more than twice two of its nearby counties. It definitely seems like an area to avoid.
The data for this layer is collected from well-respected sources, such as Johns Hopkins University, The New York Times, and Wikipedia. The sources get their data from the World Health Organization, government health ministries, and state and local health agencies and hospitals.
Google Maps is rolling out this COVID-19 info feature globally to Android and iOS this week. At the time of writing, it is not yet on iOS or iPadOS.
Until this feature is rolled out on your system, or if you are on your computer and not your mobile, read on to find out how to track the coronavirus online.
Image Credit: Google Blog, Screenshot, and Public domain