


One of the lesser-known features of the Google line of online office suites is the Explore feature. Explore does something different in each app. For instance, in Google Docs it helps you research and cite papers as you go. In Sheets, however, the Explore feature truly comes to life. It can provide a lot of information based on your data and even updates itself depending on the data you have selected. This makes the Explore feature in Sheets something that every Sheets user should check out.
How To Access Explore
In truth, accessing Explore has always been in front of you; it’s just very hard to miss! To use Explore, first open up the spreadsheet you’d like more information on. Then, click this icon that can be found at the bottom of the screen.
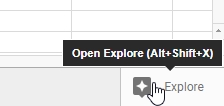
Once done, you’ll see a bar appear on the right-hand side of the spreadsheet. This is the Explore bar, and where we’ll be doing all of our work.
Also read: How to Use Google Sheets: Key Tips to Get You Started
What You Can Do
So now that we have Explore open, how can we use it to “explore” our data?
Asking Questions
First, without doing anything, you’ll notice there are some options already available for you. For instance, there’s a box where you can “ask questions” about your data alongside some examples. You can click these examples to see how Google Sheets works with this specific feature. Once you’ve gotten the hang of it, you can type a question you’d like answered into this box and get a graph tailored to your query.
Of course, you can’t just ask Sheets questions in human-styled English. For example, it won’t know what to do with “how much was spent on food?” You’ll need to type this query as something along the lines of “Total of Cost for Food,” and then Google Sheets will give you the answer.
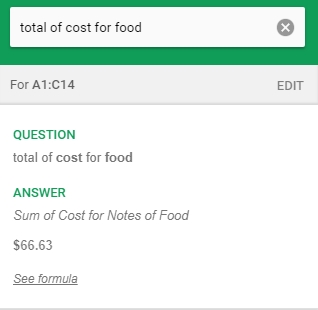
However, it doesn’t stop there. If you like how the result turned out and want to represent it somewhere within the sheet itself, you can place a formula into Google Sheets that gets you the data you just asked about. This makes it very useful if you can’t wrap your head around coding formulas; simply ask Google what you want from your data and use the formula it provides!
Formatting
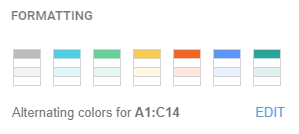
If you want to make your spreadsheet more appealing on the eyes, Explore allows you to do that, too. Just look under the “Formatting” section for ways to bring a bit of colour into your spreadsheet. This will apply the colour in an alternating pattern so that every other cell is based on the colour that you choose.
Graphs
If you scroll a little further down in the Explore pane, you’ll find that it has suggested various charts you can use. This includes a few typical pie and bar charts as well as a pivot table. You can mouse over each one for more information.
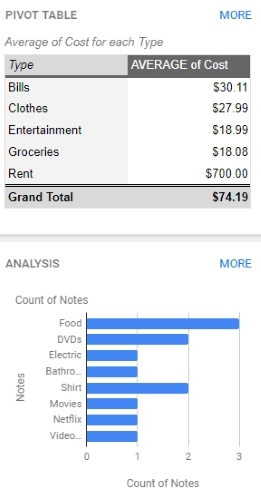
If you like the look of one in particular, you can drag it out of Explore and onto your sheet. A more detailed version of the graph will be placed onto your sheet.
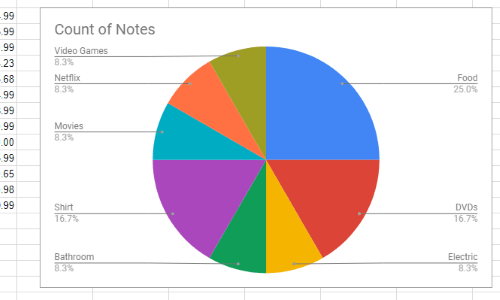
Alternatively, if you don’t like the ranges that the graphs are displaying, you can change the range to fit what you’d like. This is very easy; simply highlight the data you want as a graph on the spreadsheet. You don’t even need to close the Explore window or refresh it, as it updates automatically with the range you’ve highlighted. Once you’ve found the graph you want, you can place it just like the above example.
Exploring the Explore Feature
While you can manually create graphs and charts for your data, Explore takes a lot of the hassle out of the process. Now you know how to use the Explore feature, where it shines, and how you can tailor it to your needs.
Does this make your Google Sheets usage easier? Let us know below!